Rebuilding a marketingplatform mistaken fora logistics tool
A legacy portal that read as logistics software — not marketing automation — was rebuilt on heuristic and usability data, with rage clicks and NPS both moving sharply in the right direction.
A marketing automation platform that the market kept reading as a logistics tool.
Enviou had been shipping the same three core products — cart recovery, boleto payment, and email marketing — since 2018, without a consolidated design team able to carry a redesign through.
The problems were visible everywhere.
Customers struggled to reach the Portal and configure their automations. The product carried a legacy visual language, inconsistent interactions, and Portuguese copy errors throughout the experience.
Then the pandemic amplified the problem. The product looked and behaved like logistics software, while the brand failed to communicate that Enviou was a marketing automation platform. The gap between what the company was and what the product communicated had become a business problem.
“We needed a design approach that consolidated complex information, aligned teams, and reflected both user needs and market expectations.”Felipe, CEO
With no budget for scheduled interviews, six weeks of stakeholder sessions and a 14-month support-ticket audit became the starting point — not the final answer.
I began with the evidence available: stakeholder sessions, existing product artifacts, and 14 months of support interactions. The research surfaced five recurring areas of friction:
There was no straightforward way to trigger repurchase flows for recurring products. Clients were manually rebuilding the same automation instead of reusing purchase behaviour.
The legacy visual language, broken interactions, and Portuguese copy errors made the product feel unreliable — including when clients were using it to represent their own brands.
The email and SMS editor lacked standardized templates, forcing brands into manual workarounds for recurring campaign needs.
Credit top-up was buried four clicks deep and repeatedly surfaced in support conversations.
Statistics pages presented raw numbers without interpretation. Users could see campaign results, but couldn’t easily tell whether those results were good or what they should do next.
Support tickets echoed the same complaints: credit purchase and renewal confusion, “how do I personalize my email,” and repeated repurchase logic requests. Ticket volume wasn’t a tracked metric — NPS was — so this is framed qualitatively, not with ticket percentages.
Testing after wireframing still caught what stakeholder input couldn’t: 6 of 8 users misunderstood the repurchase window.
Round 1 — 8 users: Repurchase logic and statistics dashboard concept. 6 of 8 participants misunderstood the “suggested repurchase window” copy — leading to a full microcopy rewrite for the repurchase module, and a change from a slider to a stepped input. Round 2 — 6 users: Redesigned credit top-up flow and navigation. Time-to-complete for “buy more credits” fell from 42s to 11s, validating the new flow before build.
Wireframes existed around week 7, so discovery order was backwards from best practice — validation came after concept, not before. Even 3–4 unmoderated guerrilla interviews earlier would have caught this two weeks sooner.
A 40-page heuristic audit became a prioritization system — not a list of UI problems.
Stakeholder sessions confirmed what had prevented previous redesigns from sticking: decisions had never been documented. So the heuristic audit was structured to solve that problem. Rather than documenting isolated screen-level issues, each finding was traced back to a reusable component or interaction pattern.
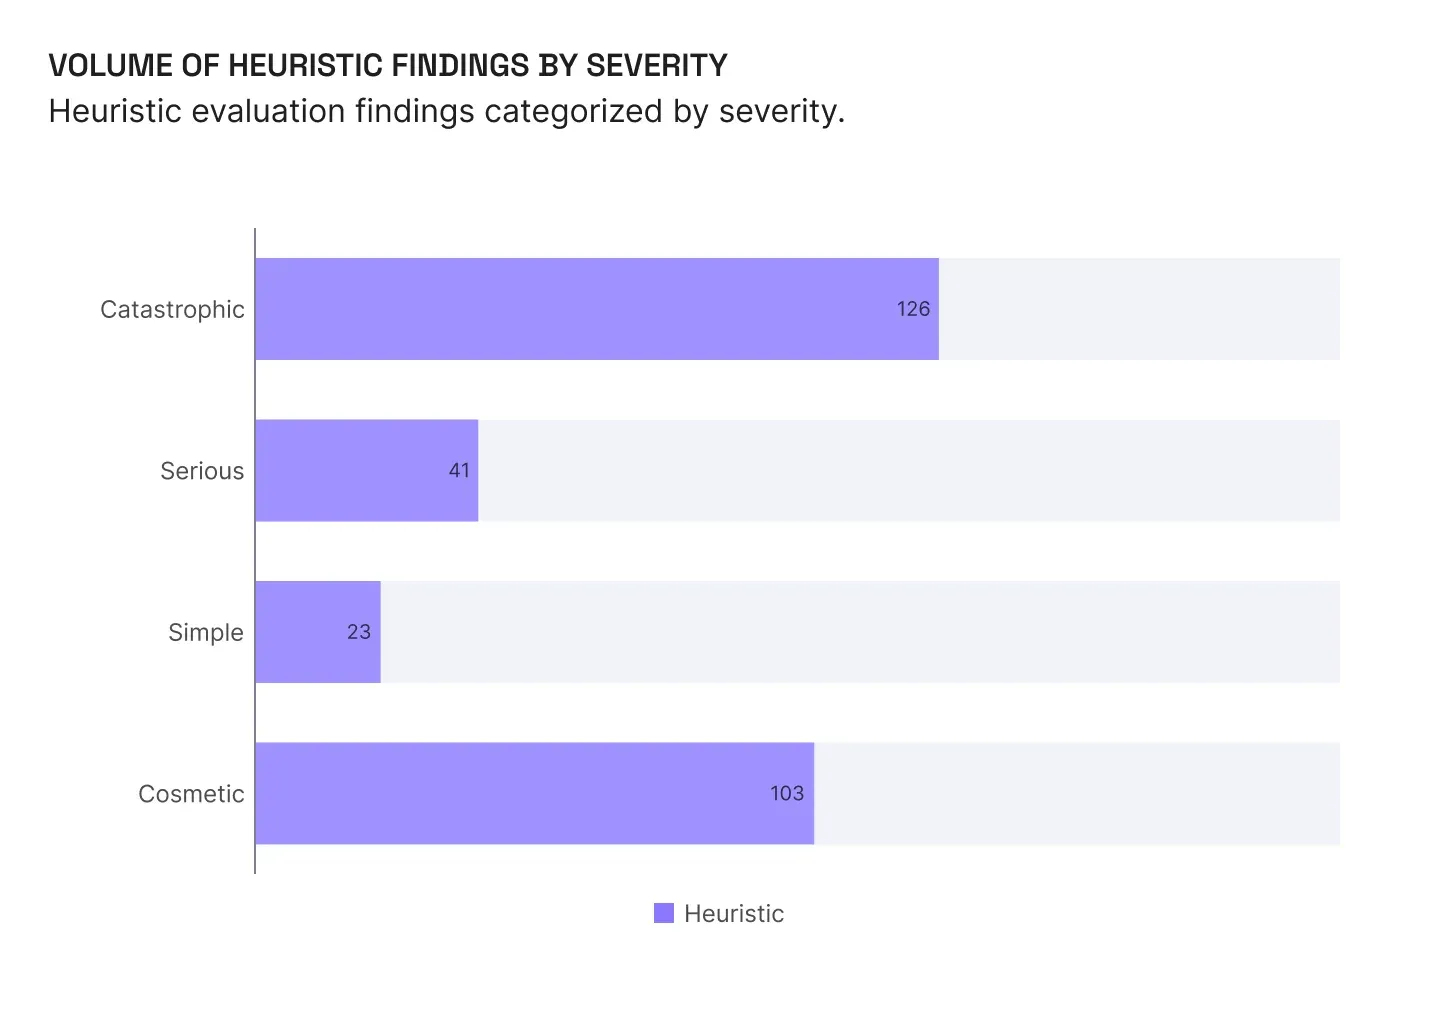
We structured the audit atomic-design-style — atoms, molecules, organisms — and each finding shipped with a recommended fix and an estimated engineering effort. That practice didn’t exist at Enviou before, and it’s the reason this report drove real sprint work instead of sitting in a drawer.
One banner, six broken heuristics — and a fix for each one.
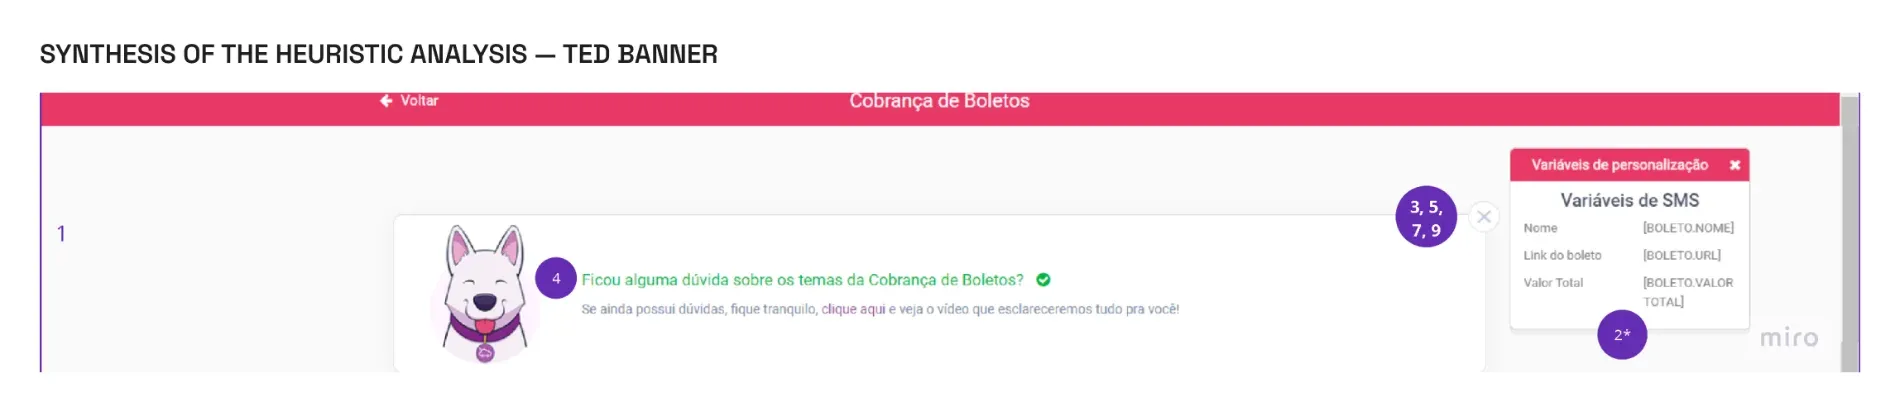
Deleting the card removed it entirely until the page was refreshed. There was no minimize state, no undo, and warnings often failed to reflect the current state of the tool.
Experienced users could recover, but the missing undo still created unnecessary work. For less experienced users, losing the card without recovery was a much more severe failure.
The automation color system was inconsistent with the rest of the product, while the resulting pop-up appeared far from the interaction that triggered it.
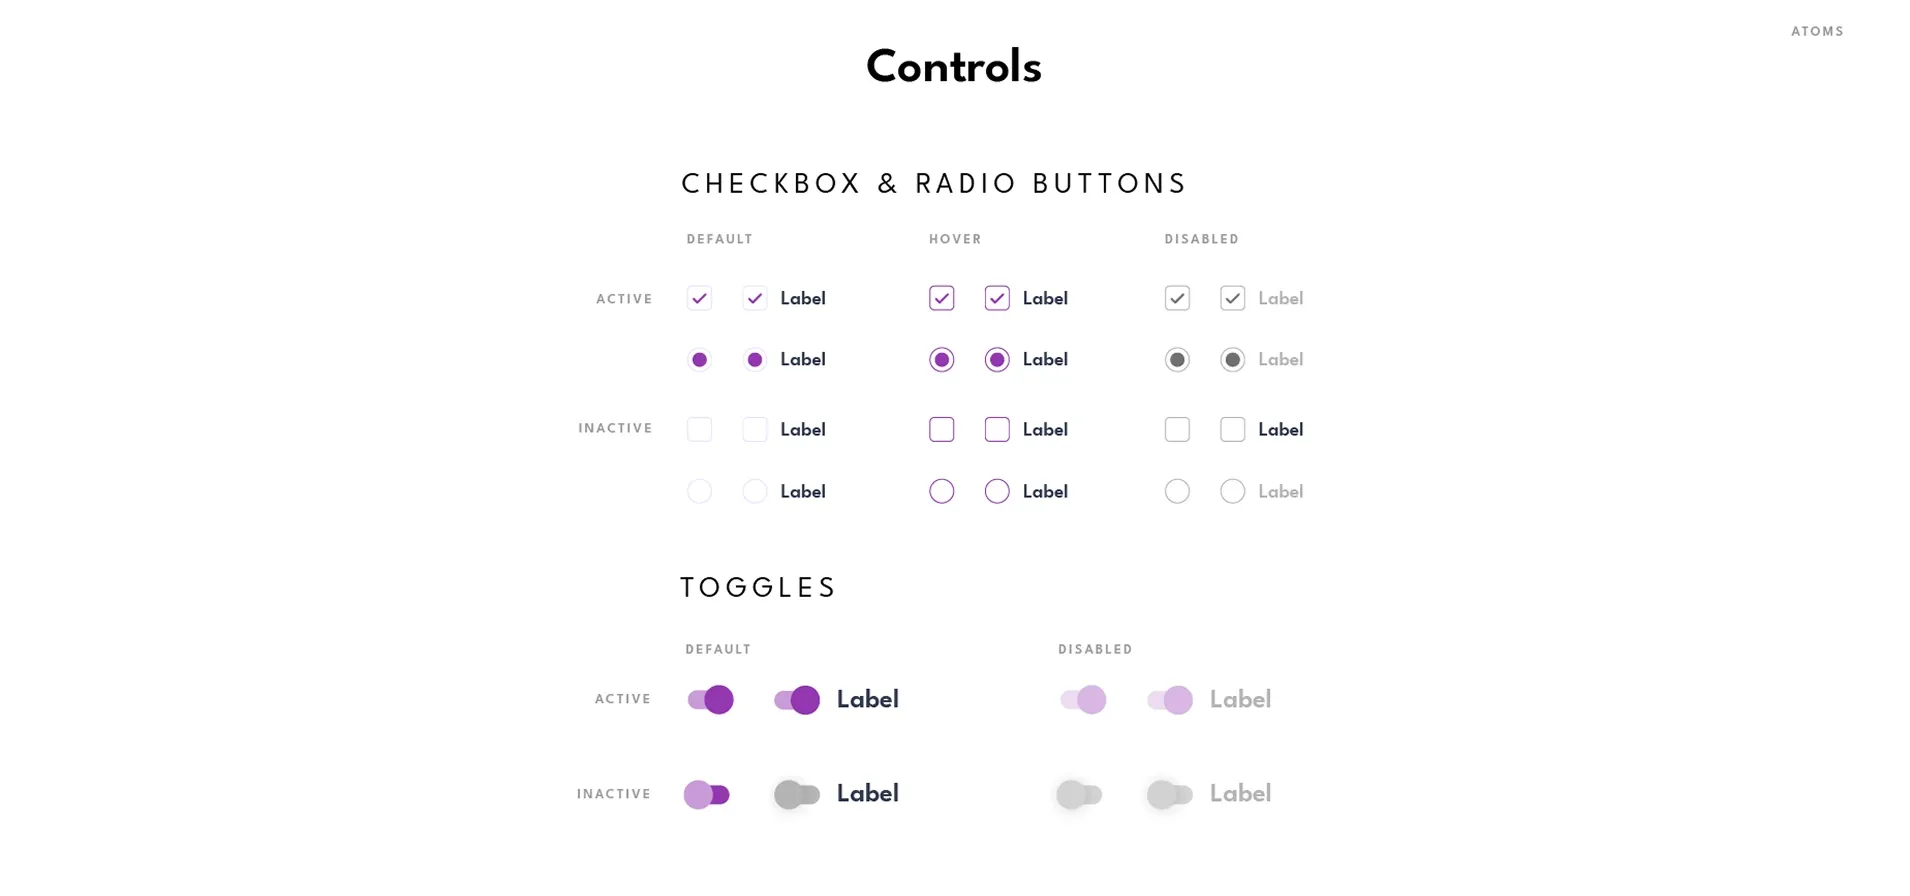
Fixing the system before the screens — a design system as a decision log, not a component library.
I led the design system as part of the new product governance model. New component requests went through a lightweight RFC: a one-page decision document followed by asynchronous review before anything was added to the system. It was to make design decisions visible, reusable, and harder to reverse without a reason.
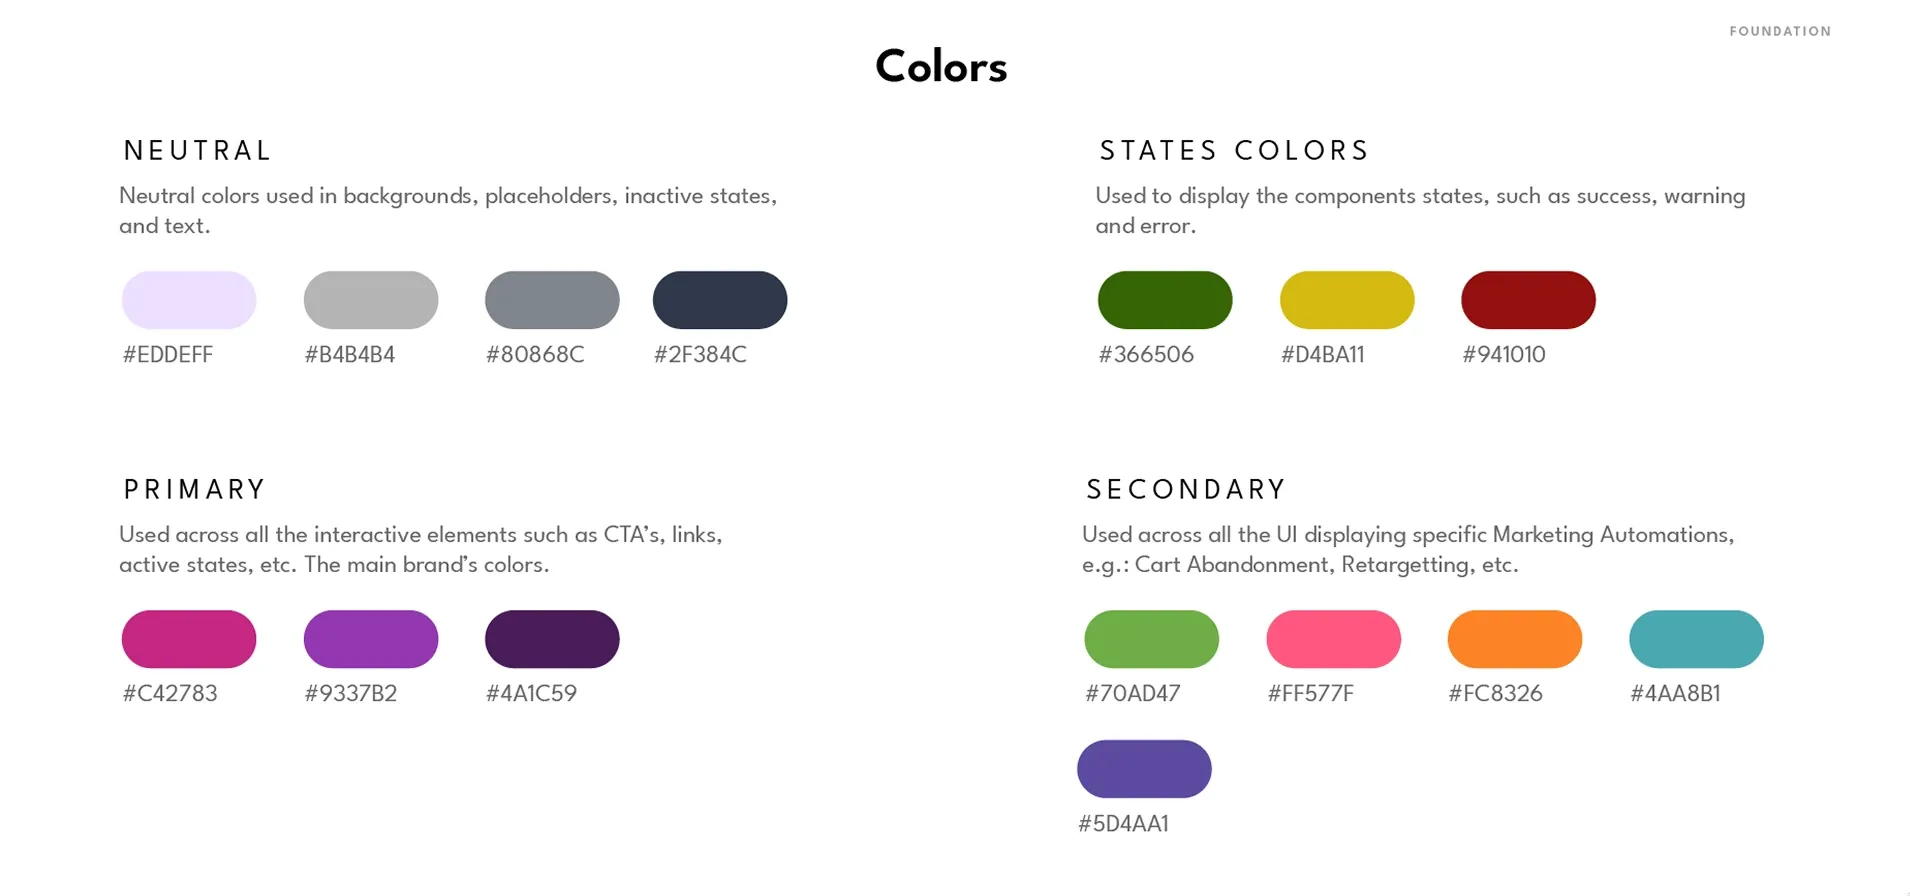
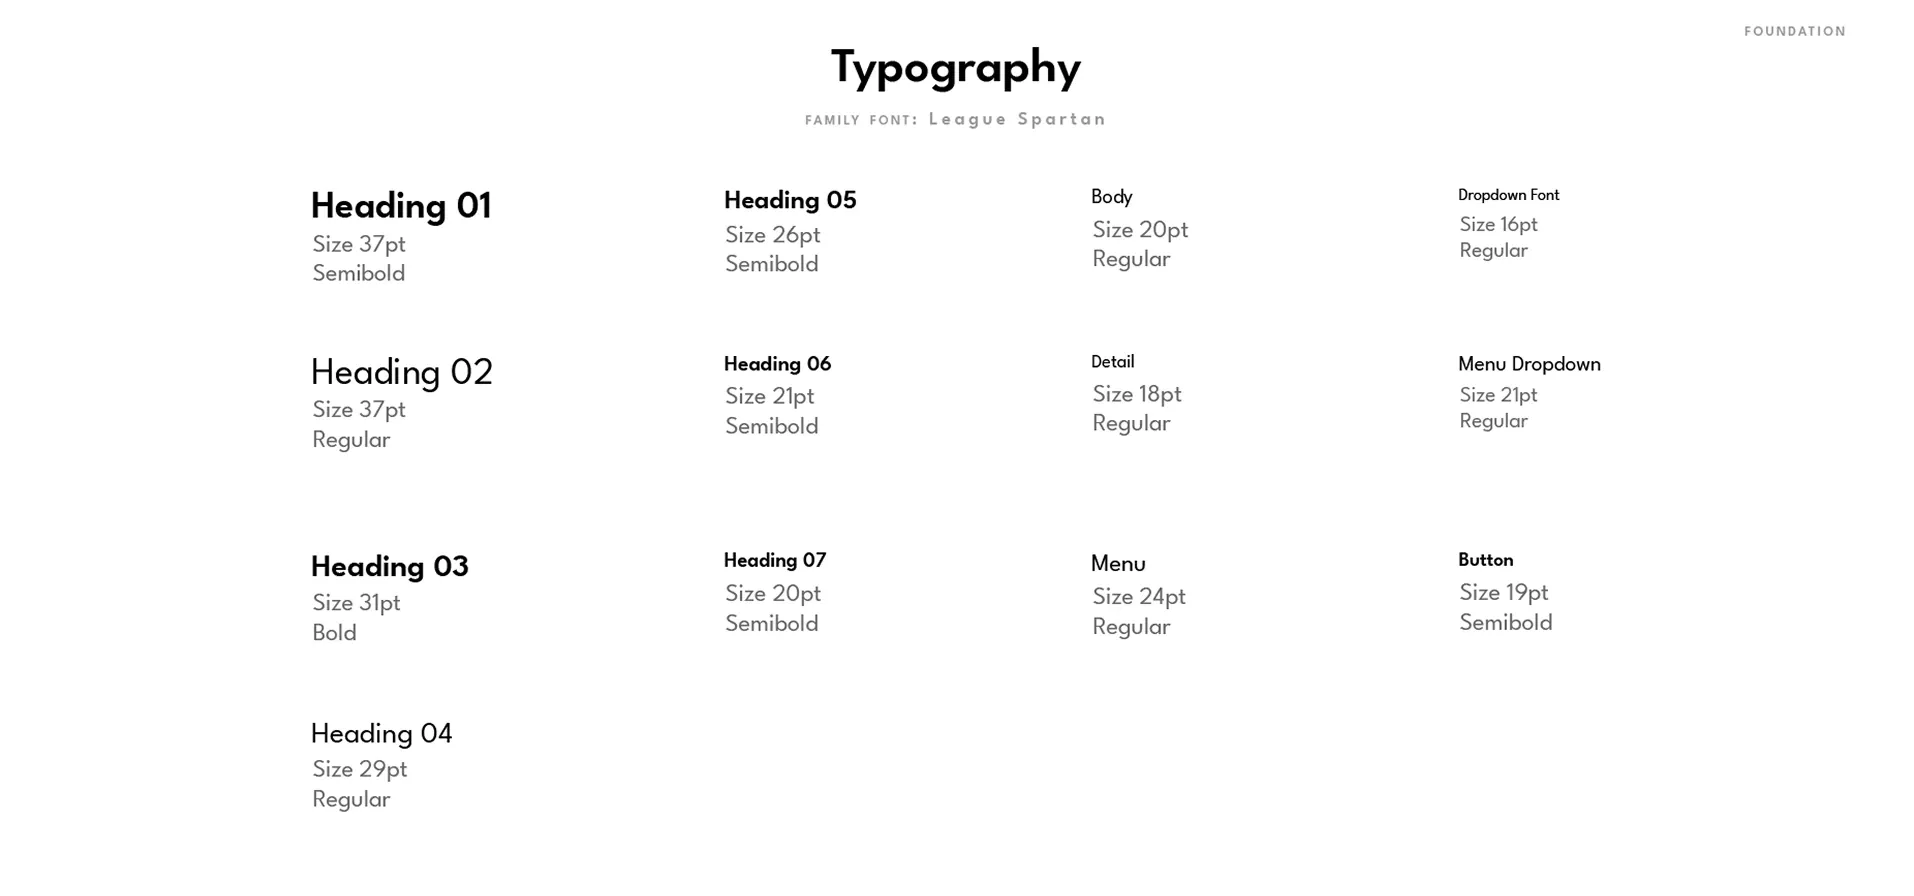
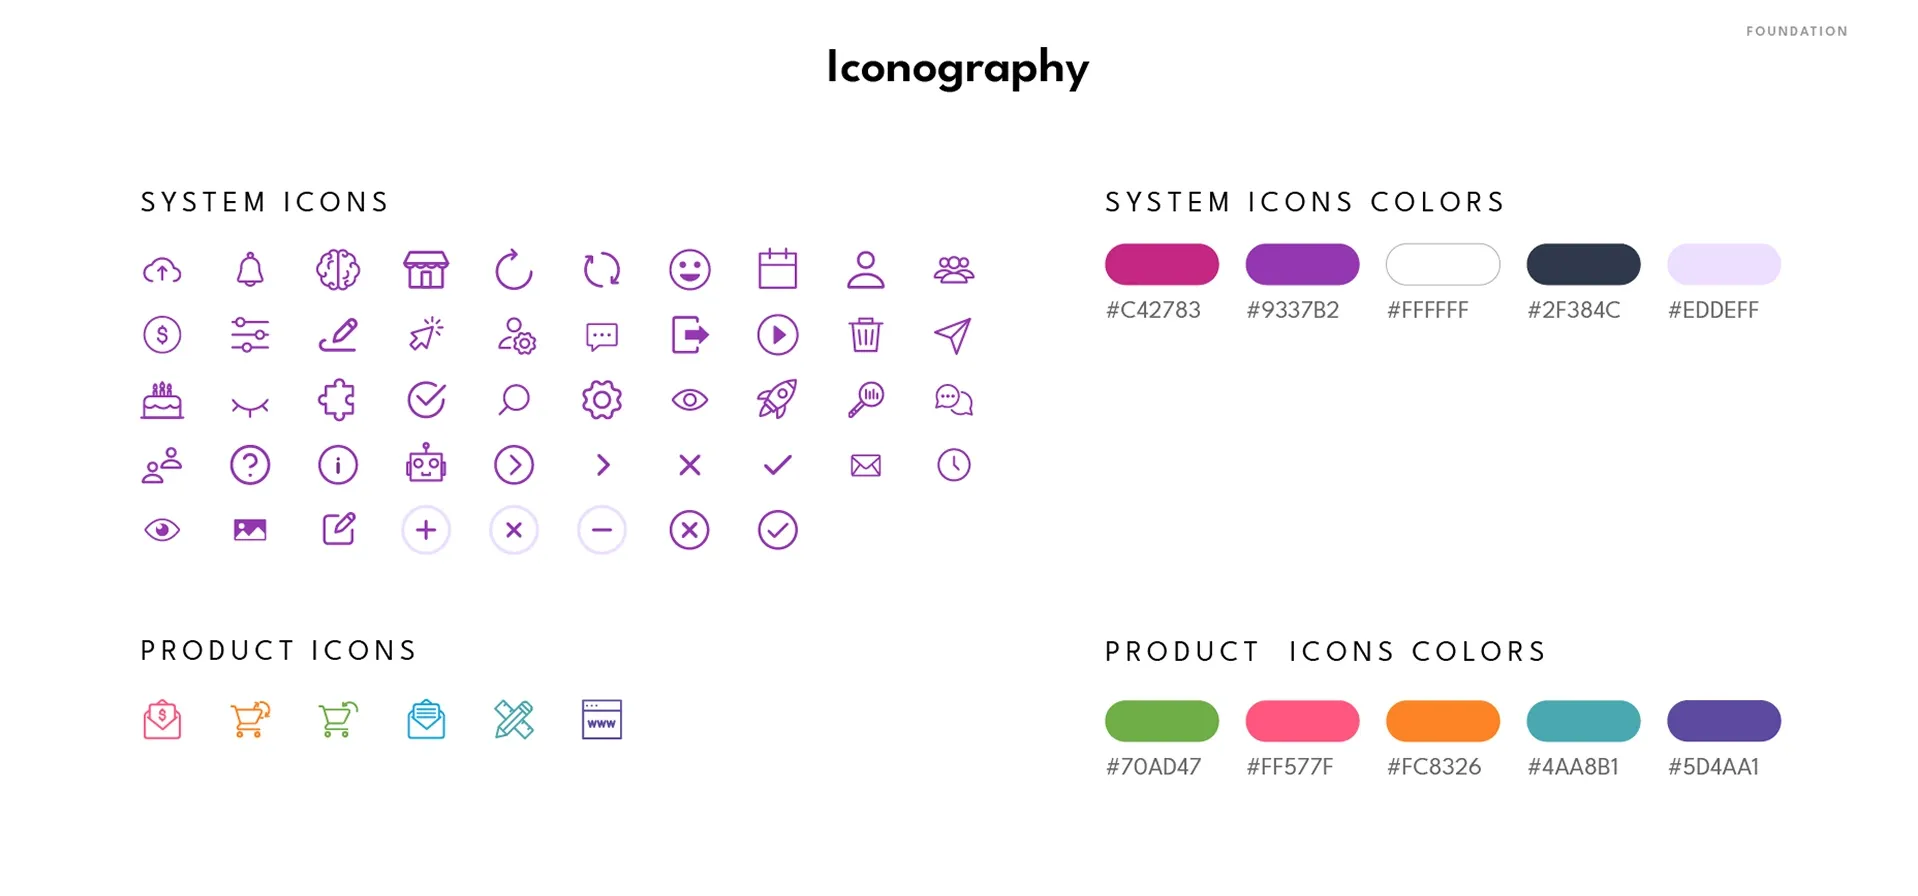
New logo, color system and typography — extended into the product UI so brand and product stopped looking like two companies.
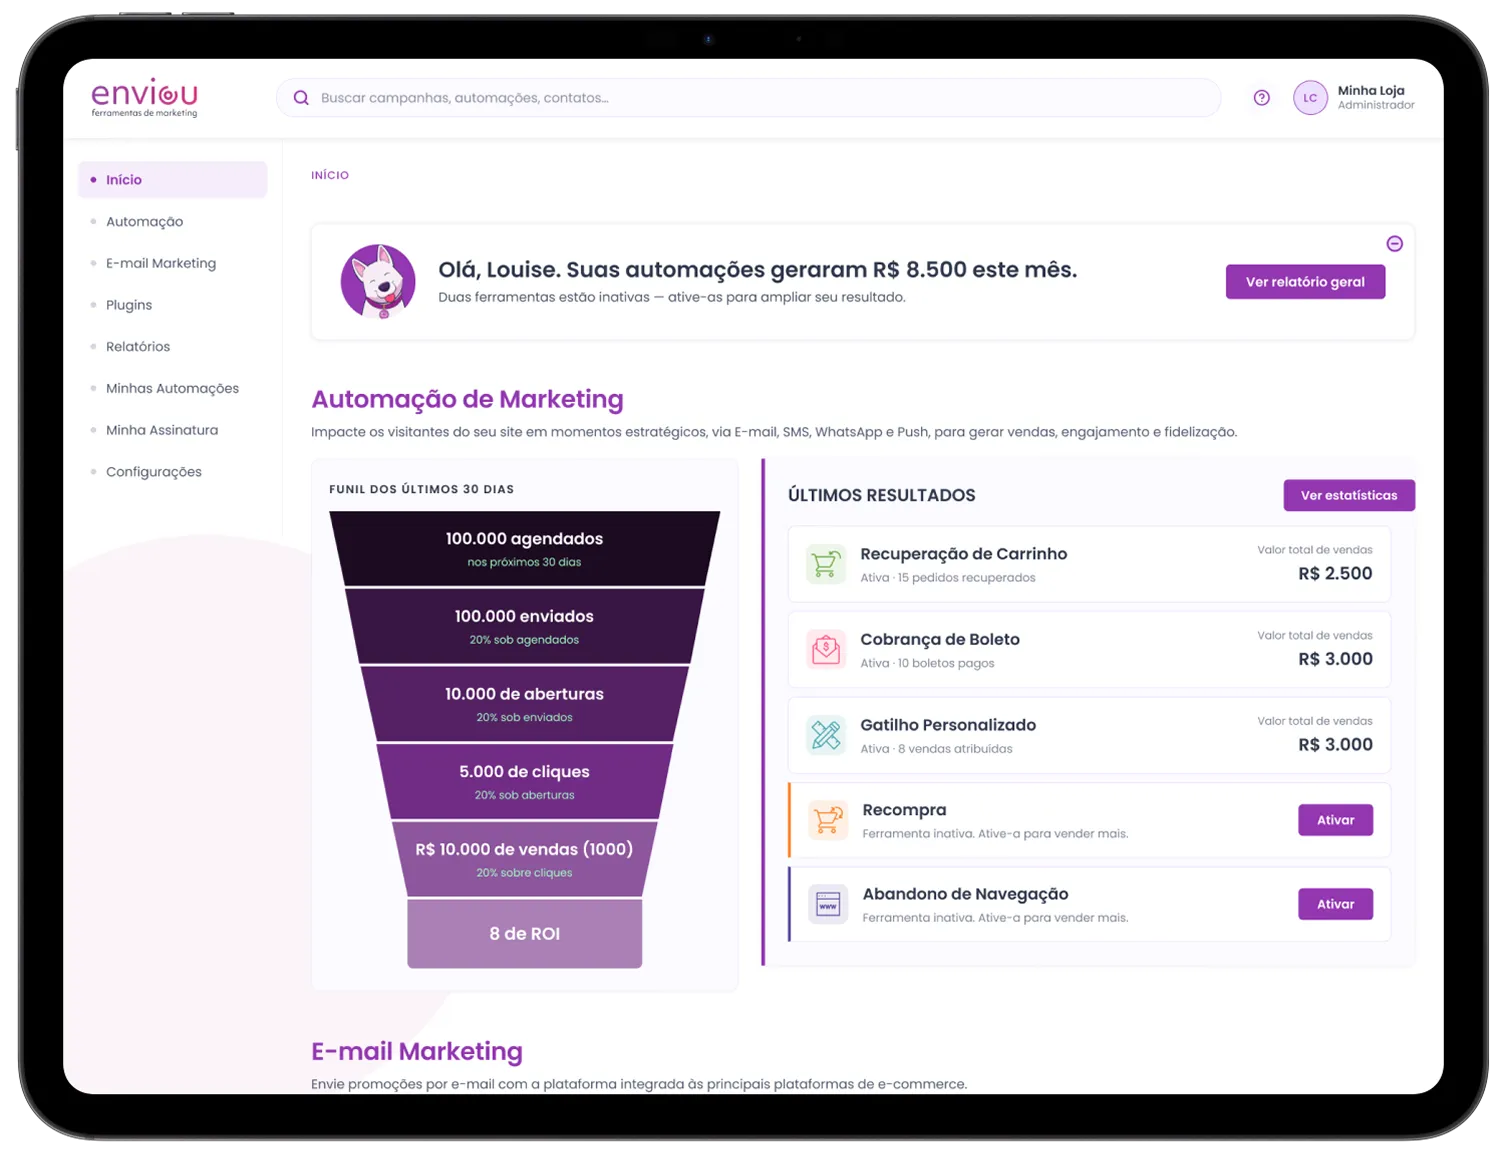
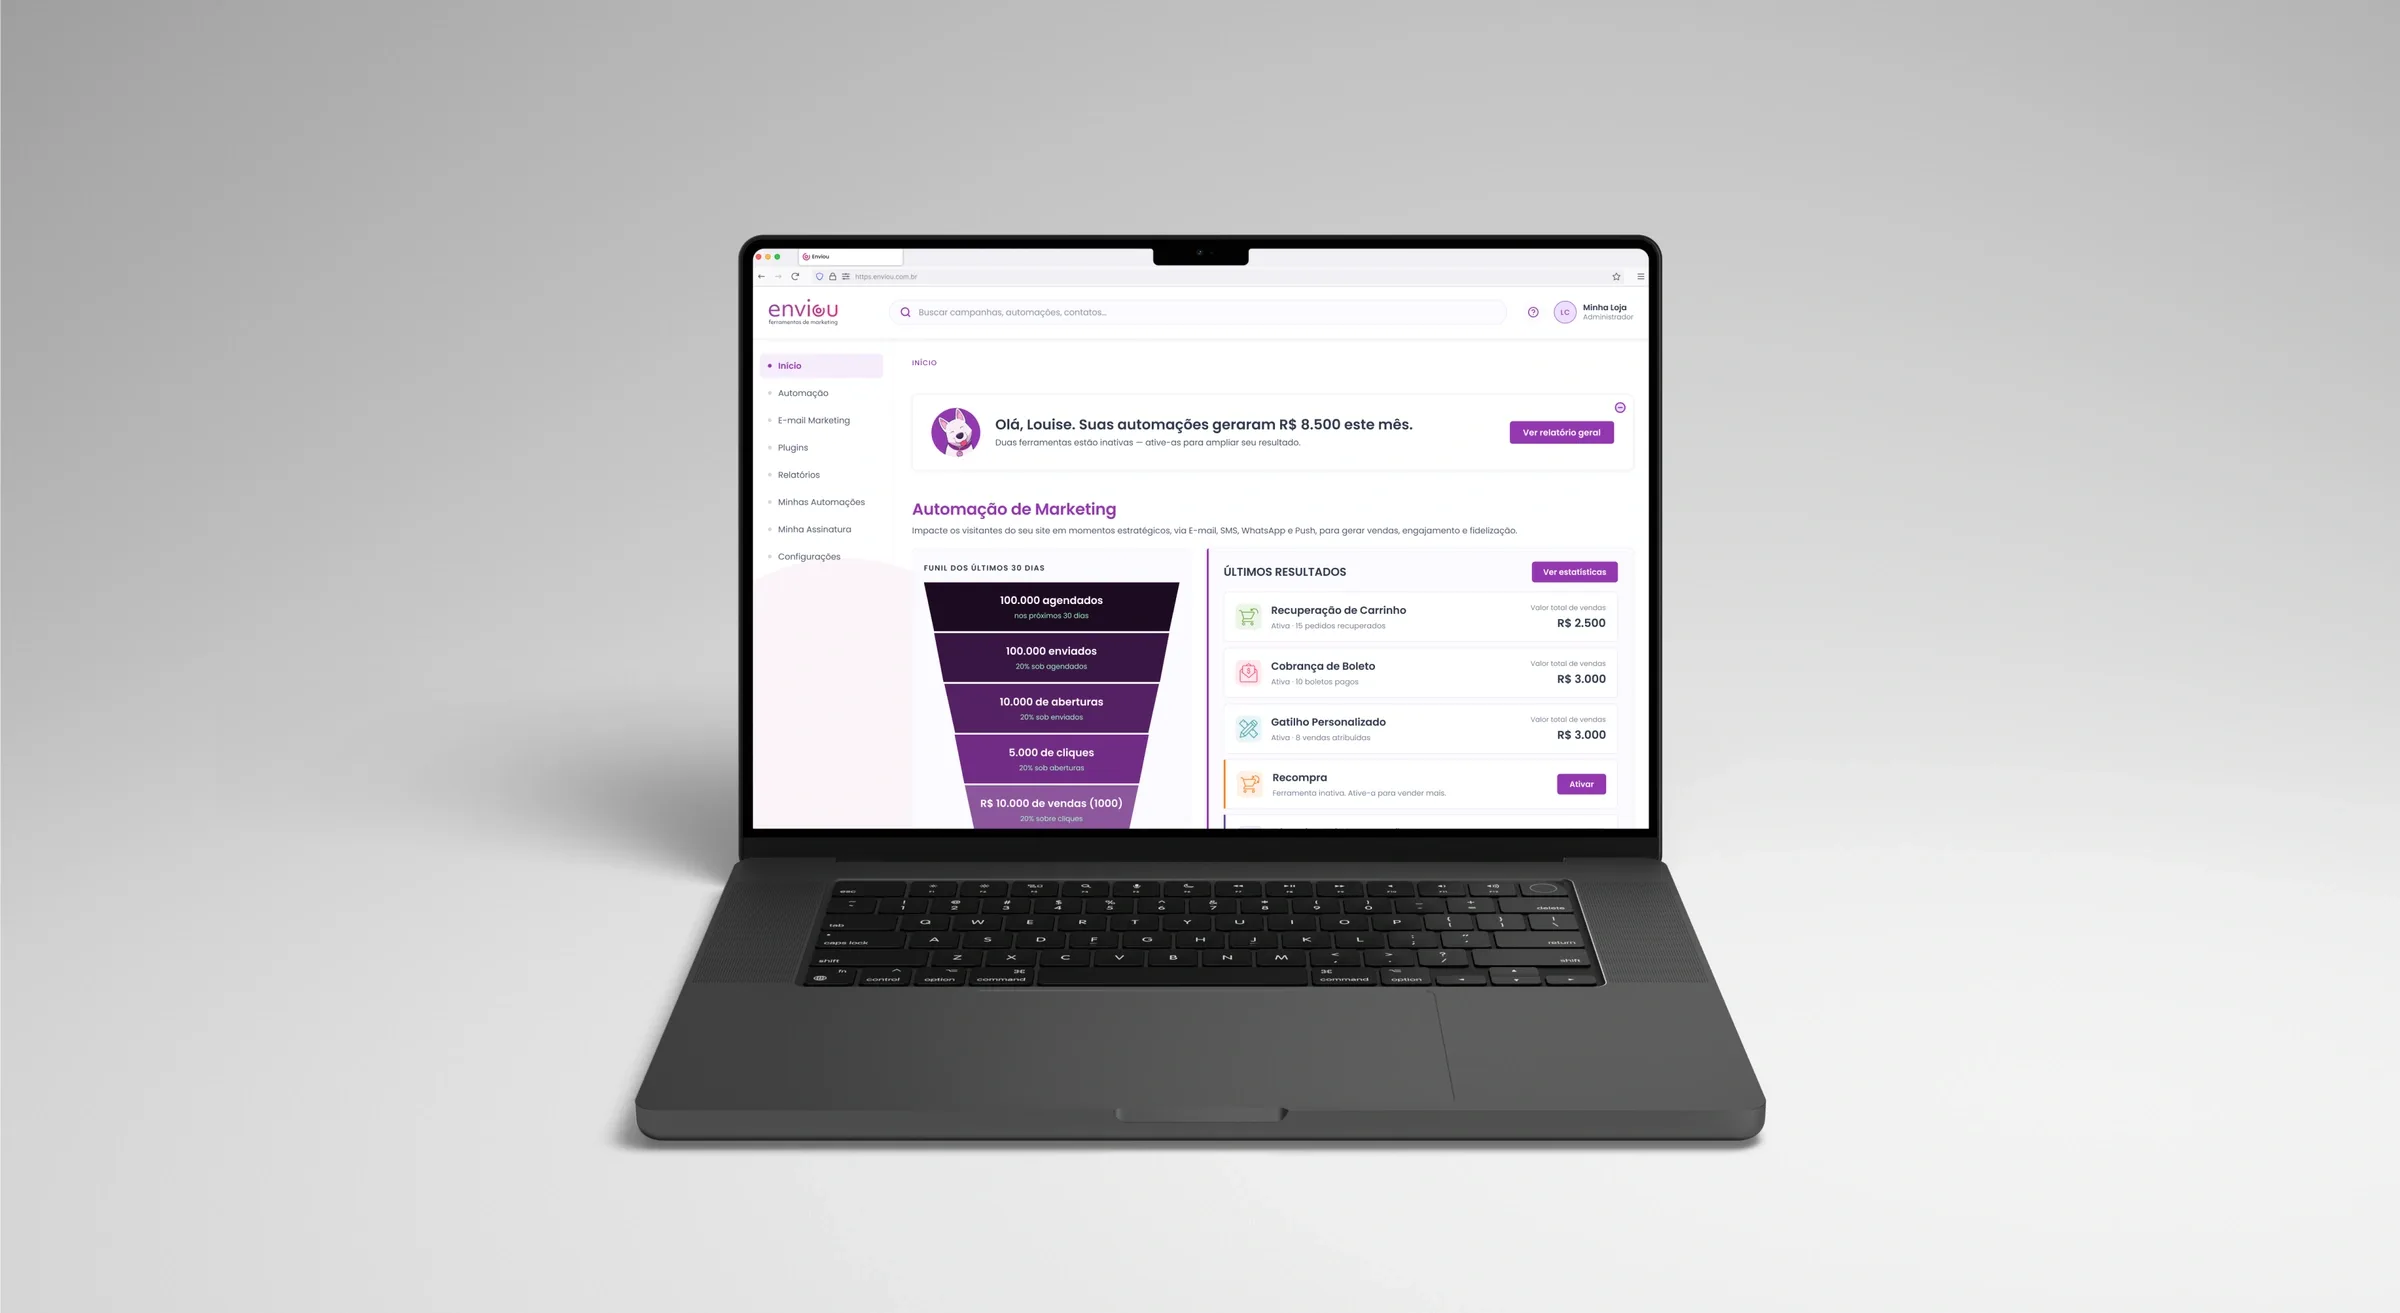
Rebuilt automation creation, credit management and the statistics dashboard. Channels expanded beyond email and SMS to push and WhatsApp, unified under one creation flow instead of three.
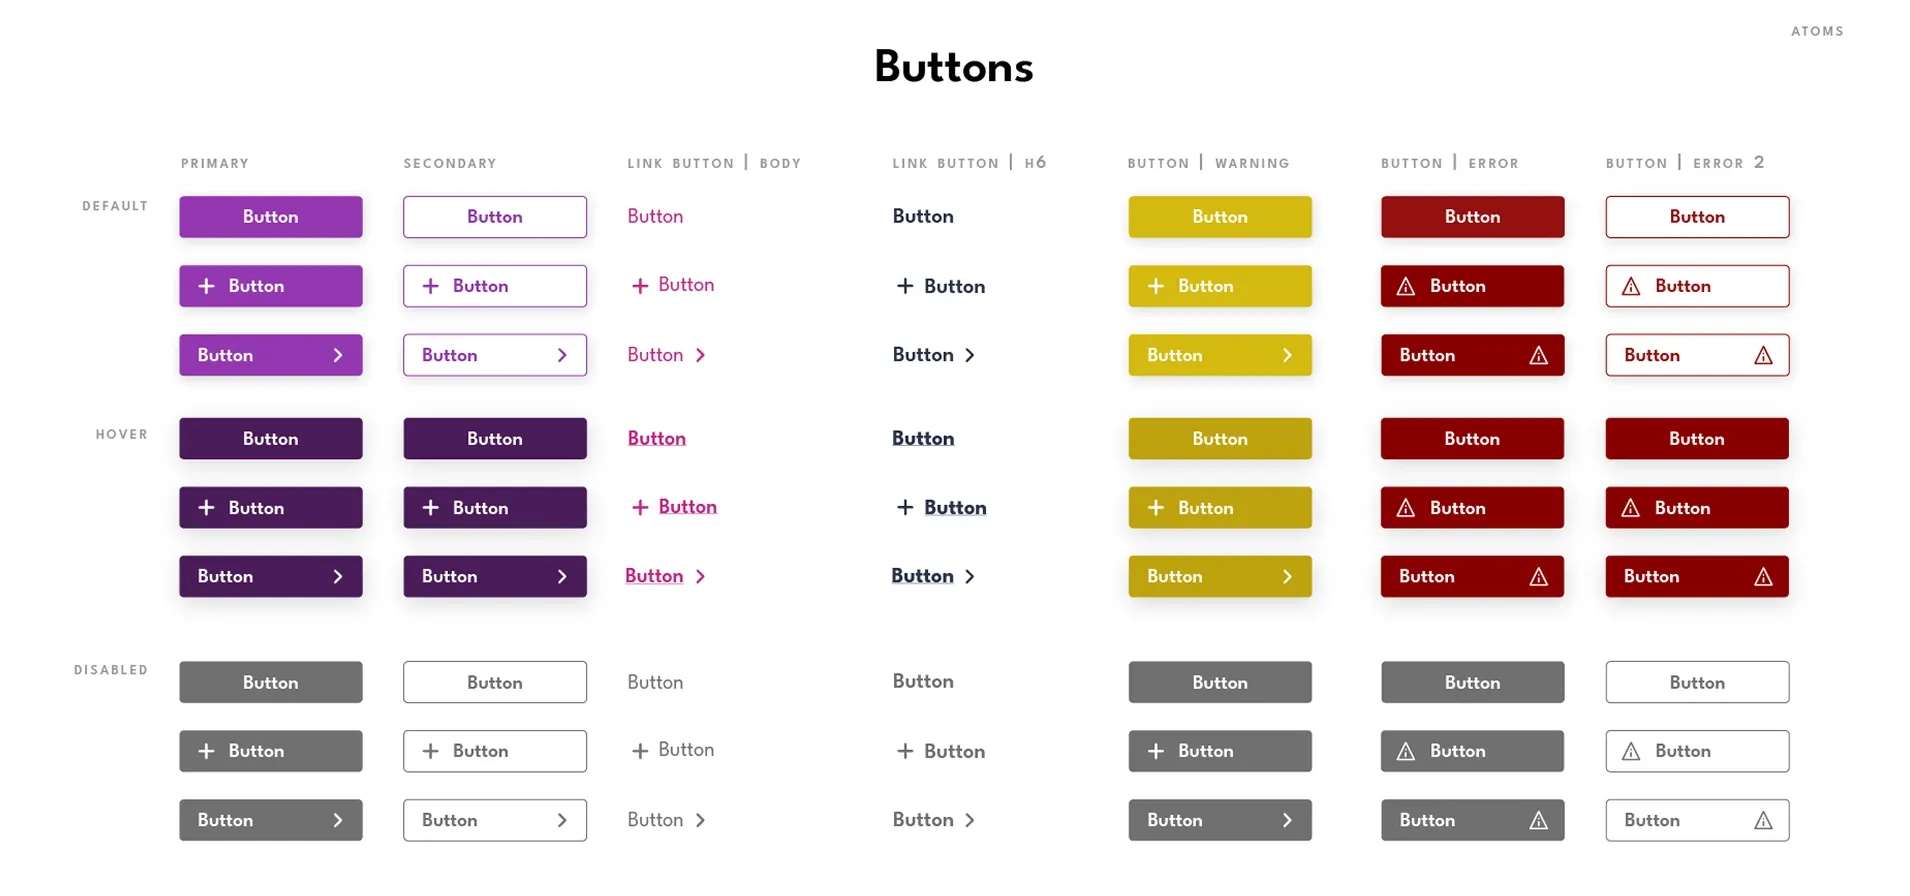
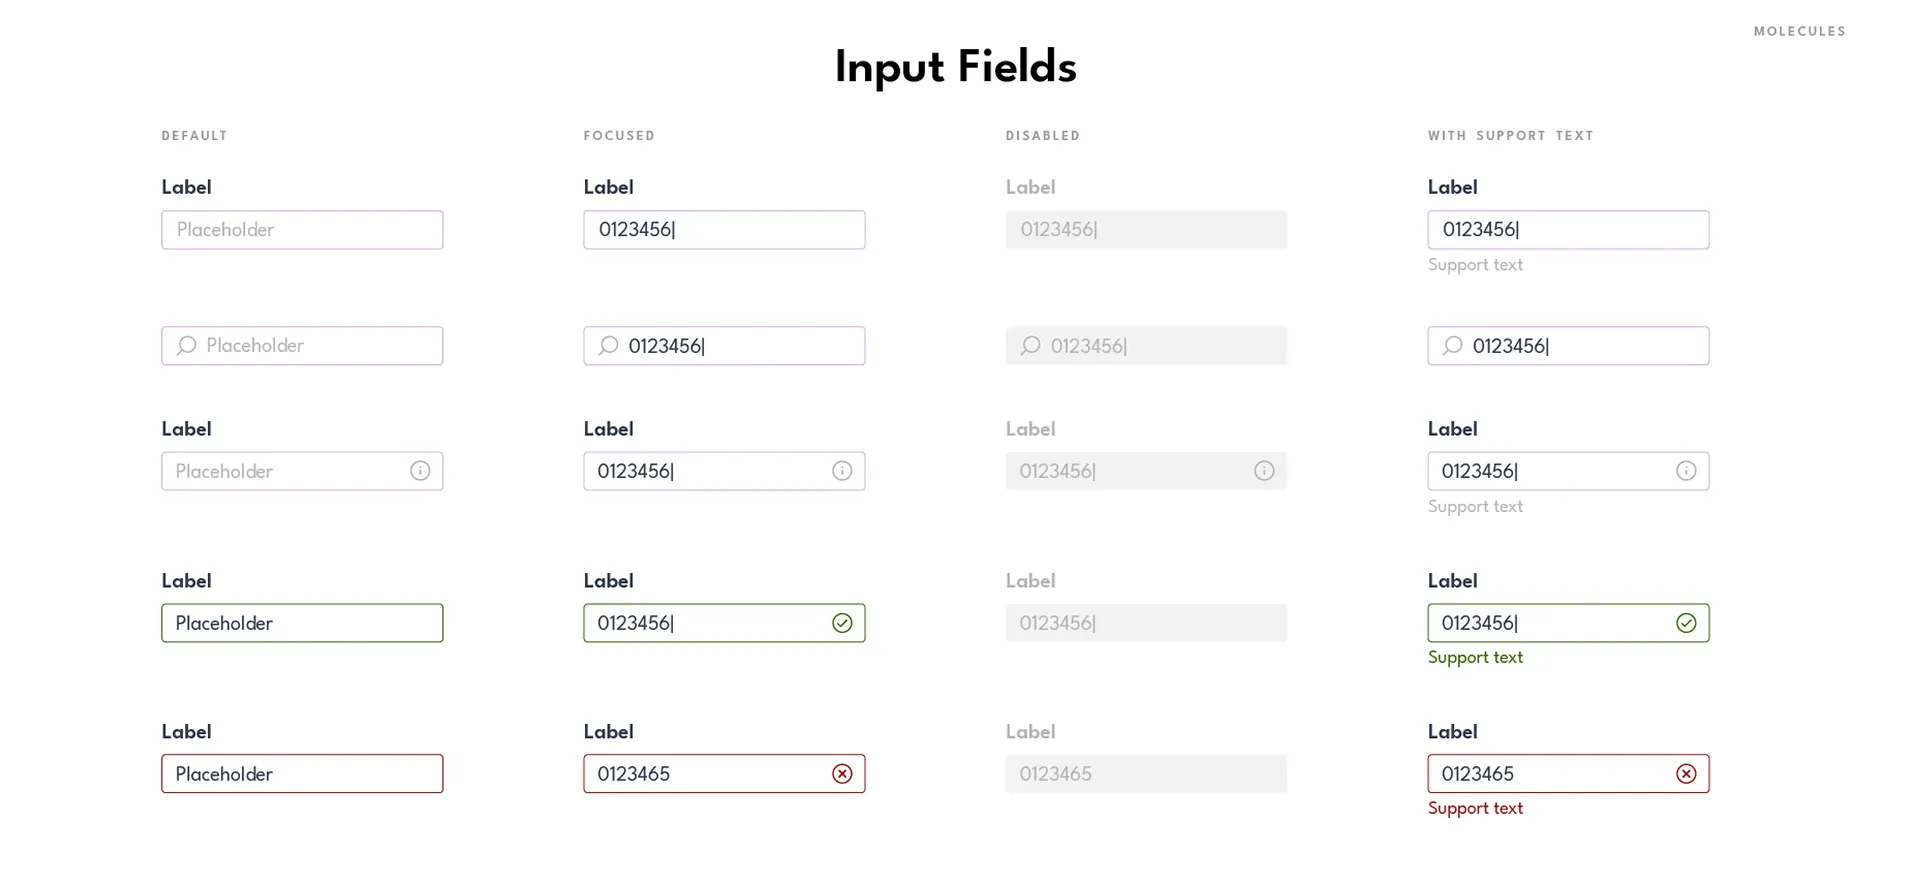
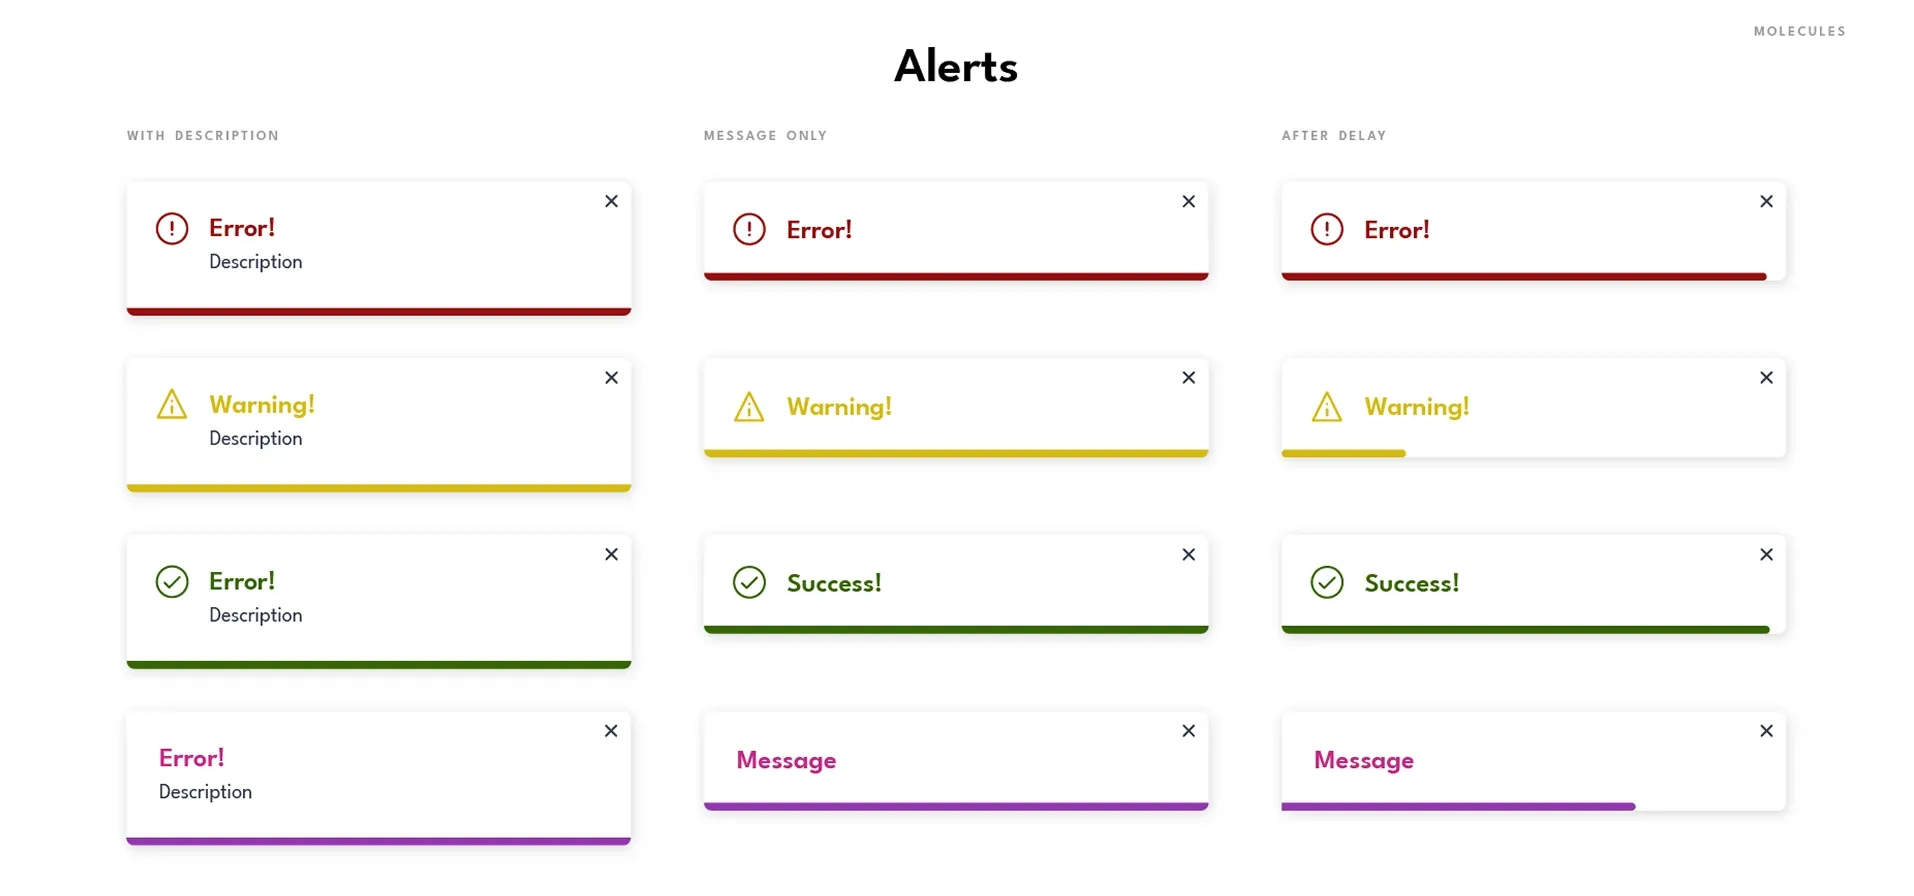
Repurchase, wired to real Shopify purchase data instead of manual guesswork, drove automations per account from ~4 to 15.
Three new automations shipped alongside the redesign, each answering a different pressure point uncovered along the way.
Built directly from a discovery finding — clients were manually recreating the same automation for recurring products. It connects to Shopify, pulling both product catalog and actual purchase data, so the repurchase window reflects real buying behavior rather than generic timing.
Essentially a “dev area” inside the product, letting companies structure fully custom personalization logic. Intentionally not broadly accessible — for larger clients with an in-house technical team, it’s a sustainable advantage over requesting custom work.
The third automation launched in this project, bringing Enviou’s catalog closer to what competitors already offered.
Two screens that turned support tickets into self-service.
My subscription page
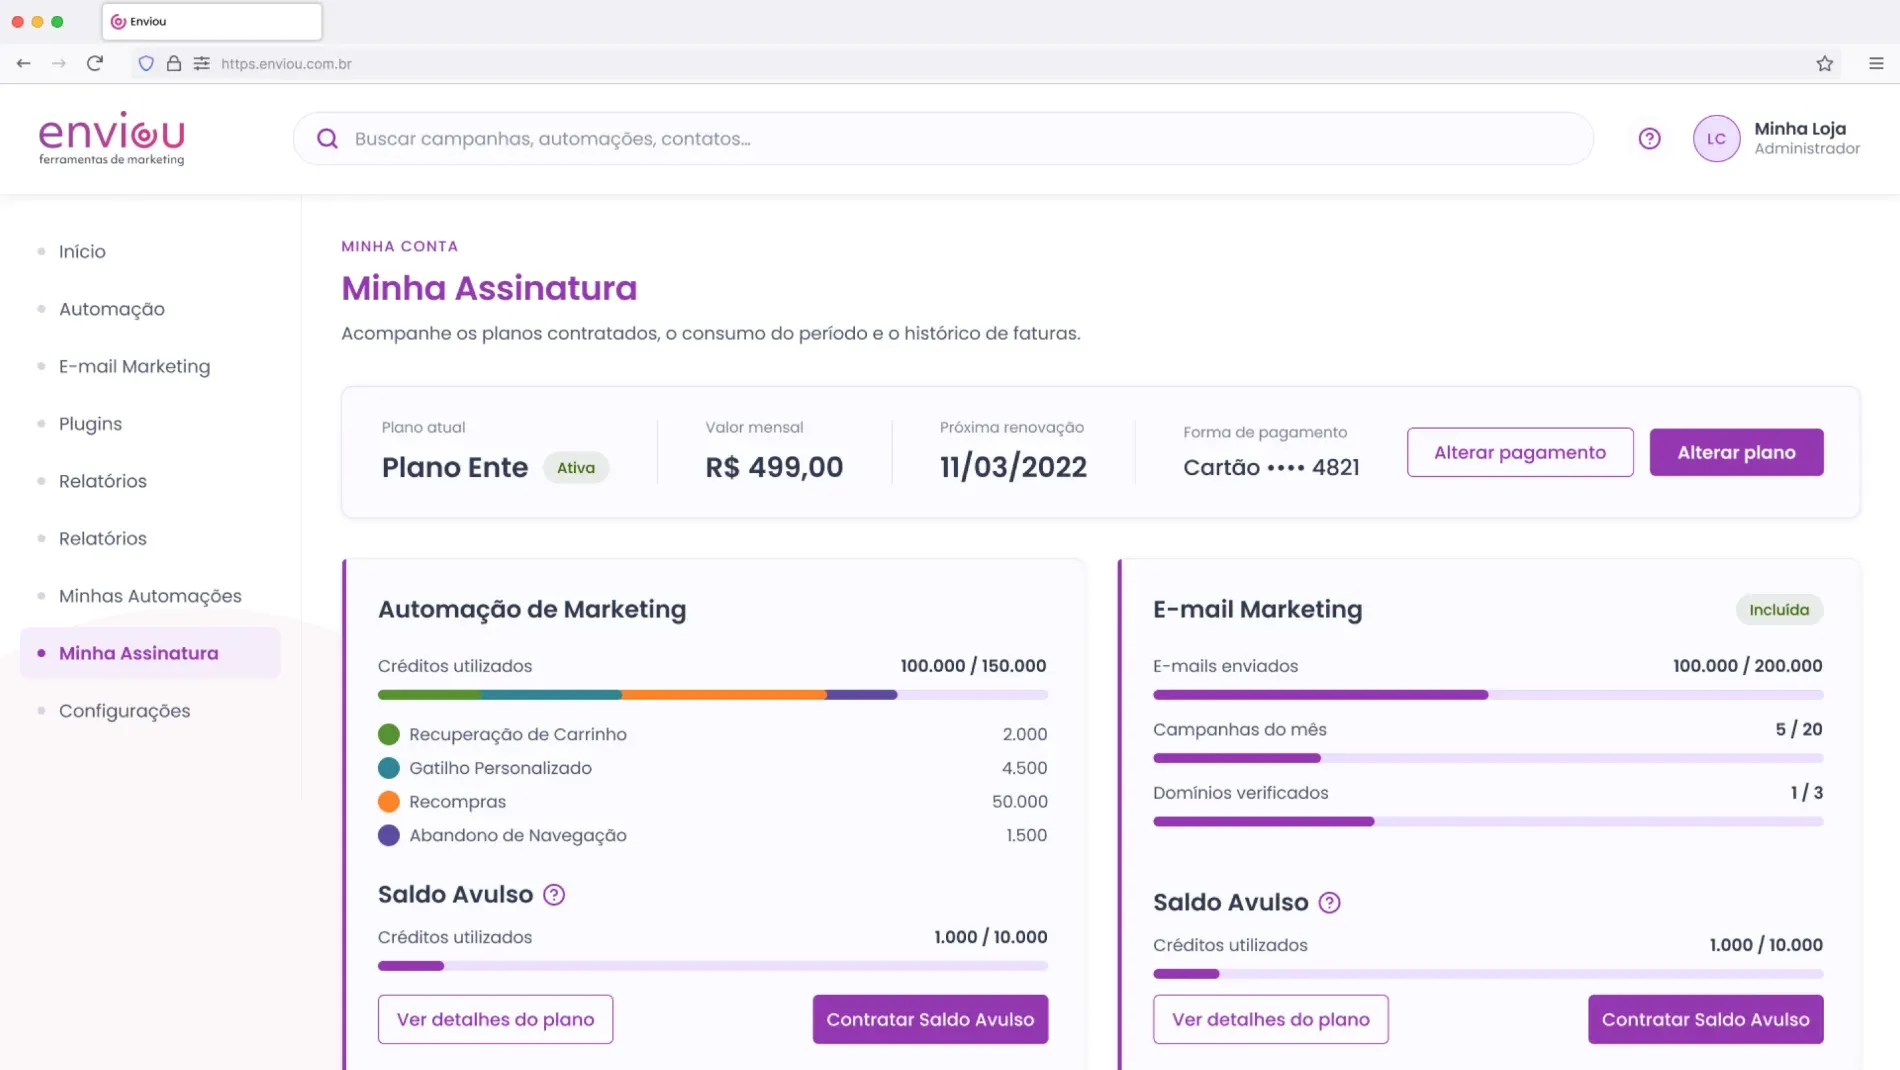
Credit purchase and renewal were recurring user needs, while the top-up flow was buried four clicks deep.
My Subscription — one of the most requested additions — lets clients see credit usage per product without leaving the flow or opening a ticket.
My automations page
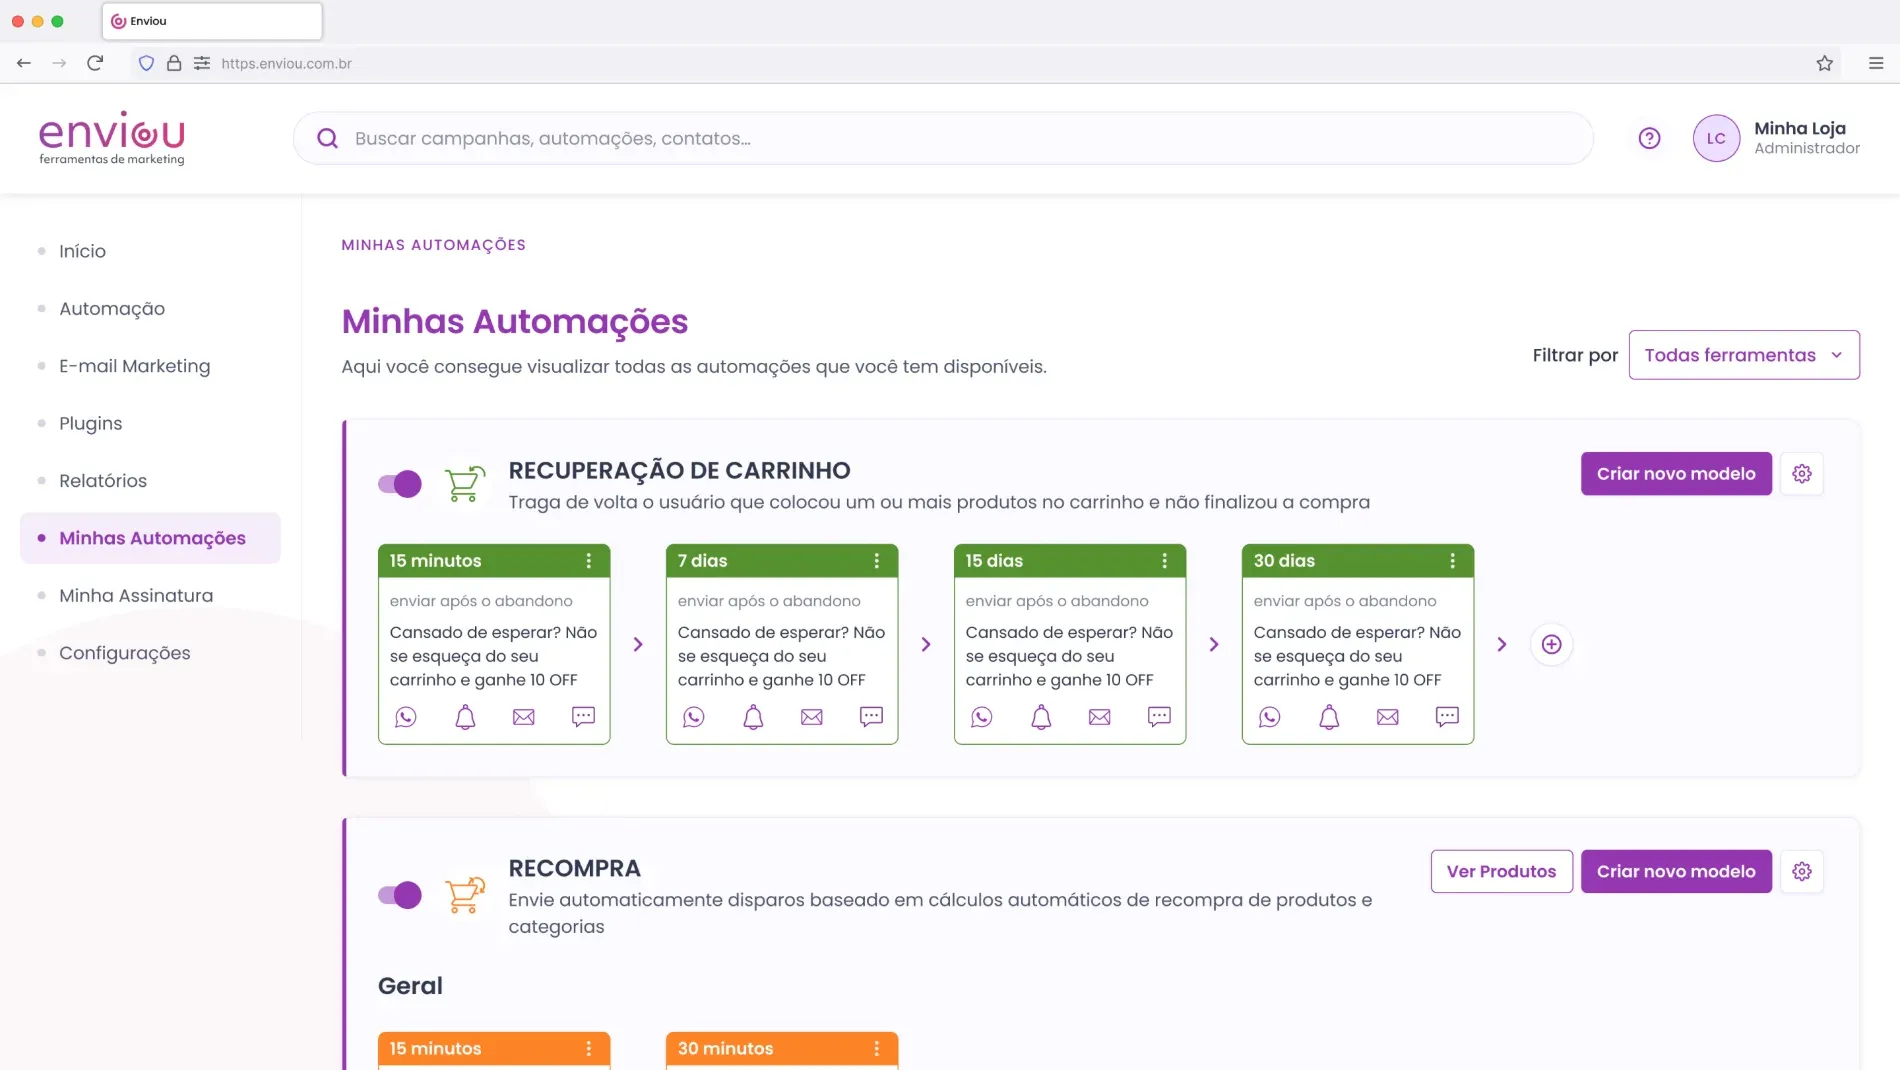
Clients had no reliable overview of which automations were running or which channels each automation was using.
My Automation lists every product’s automations in one place, with a live signal for which channel — email, SMS, WhatsApp or push — is active on each.
A redesign guided by heuristic and usability data — not aesthetic preference — cut rage clicks by 80% and lifted NPS from 44 to 60.
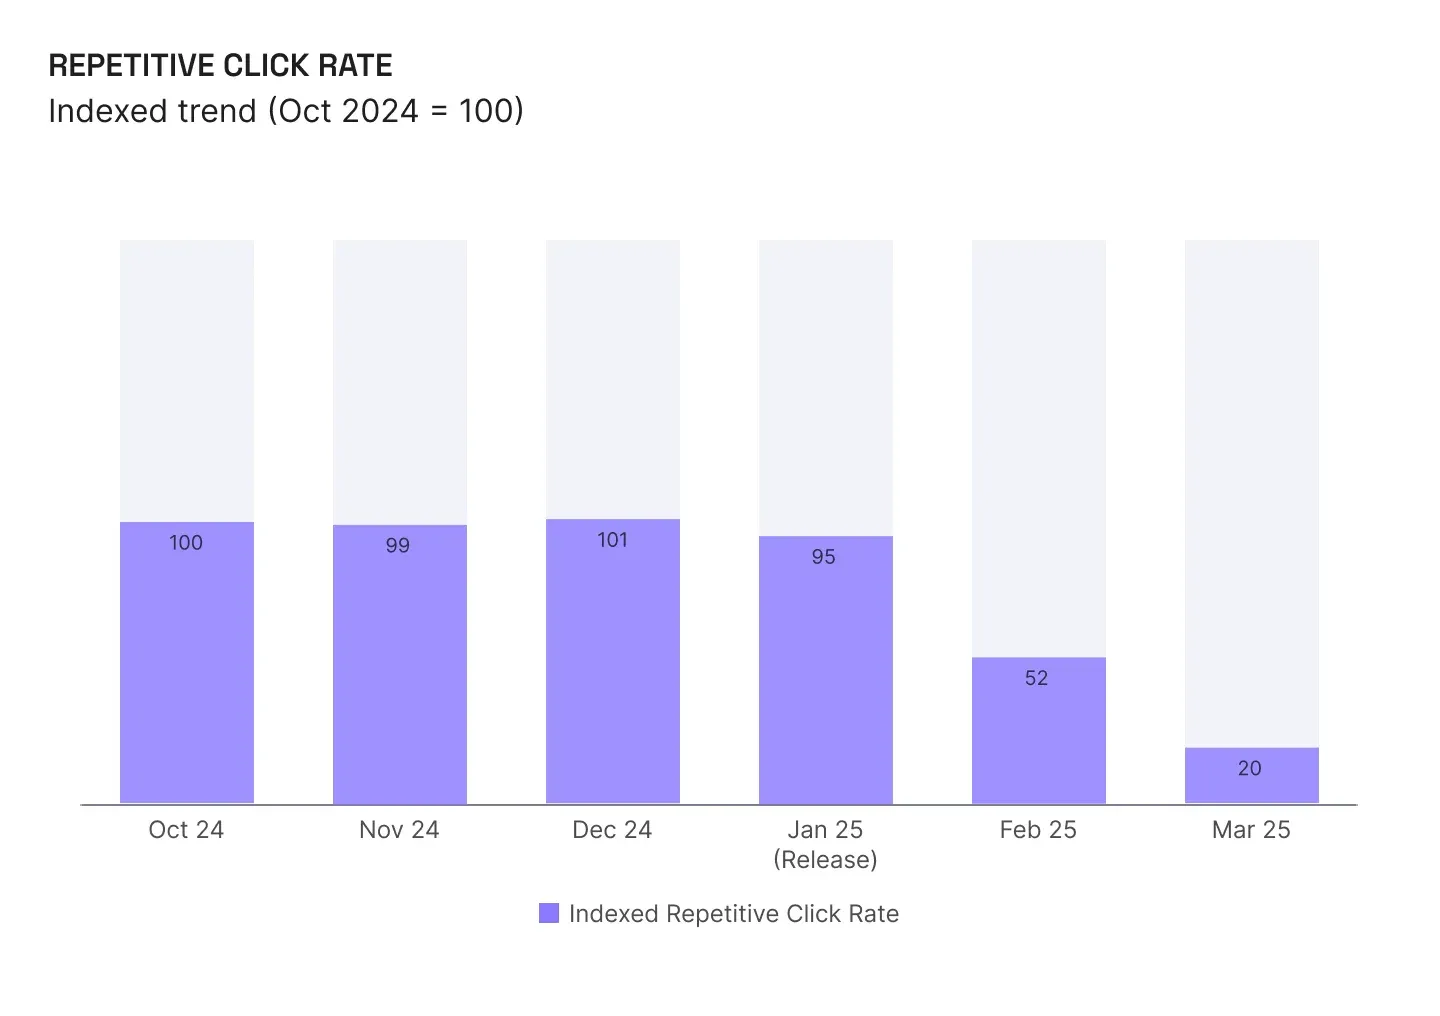
New client signups grew 75% in the same quarter. This result should not be attributed to design alone. The redesign launched alongside pricing and marketing initiatives, so the data cannot isolate the design contribution to acquisition.
The system — not any single screen — is what outlasted the team that built it.
Reorder discovery and validation — test before wireframing, not after · push harder for a real accessibility audit, not just contrast and keyboard defaults · push harder for dedicated research earlier, rather than running discovery solo · instrument attribution from day one, isolating design impact from pricing and marketing changes.
Three redesigns failed because nothing was written down. This one held because the decisions were.Closing thought