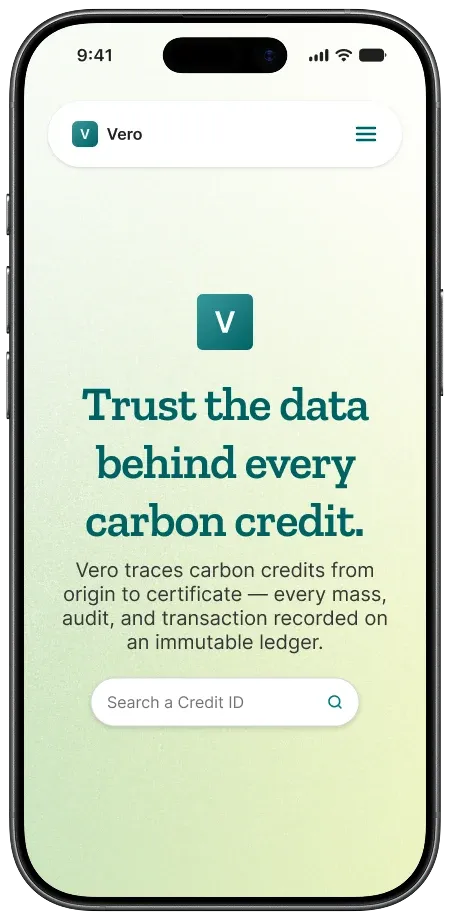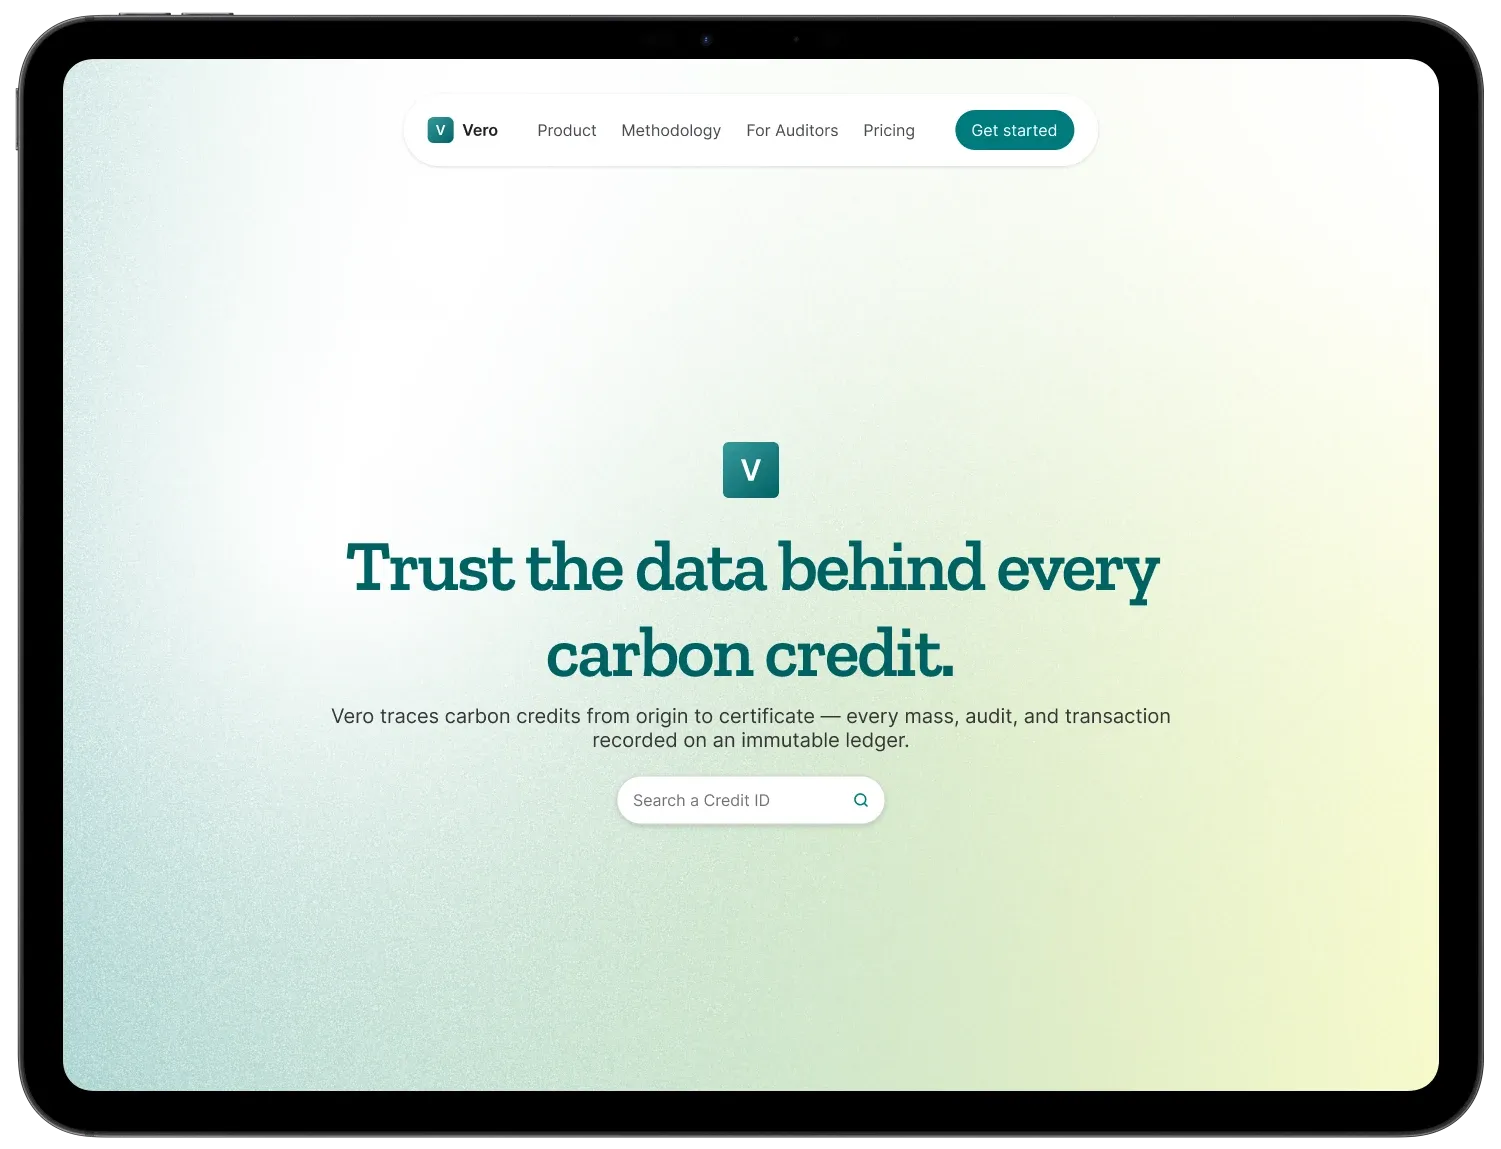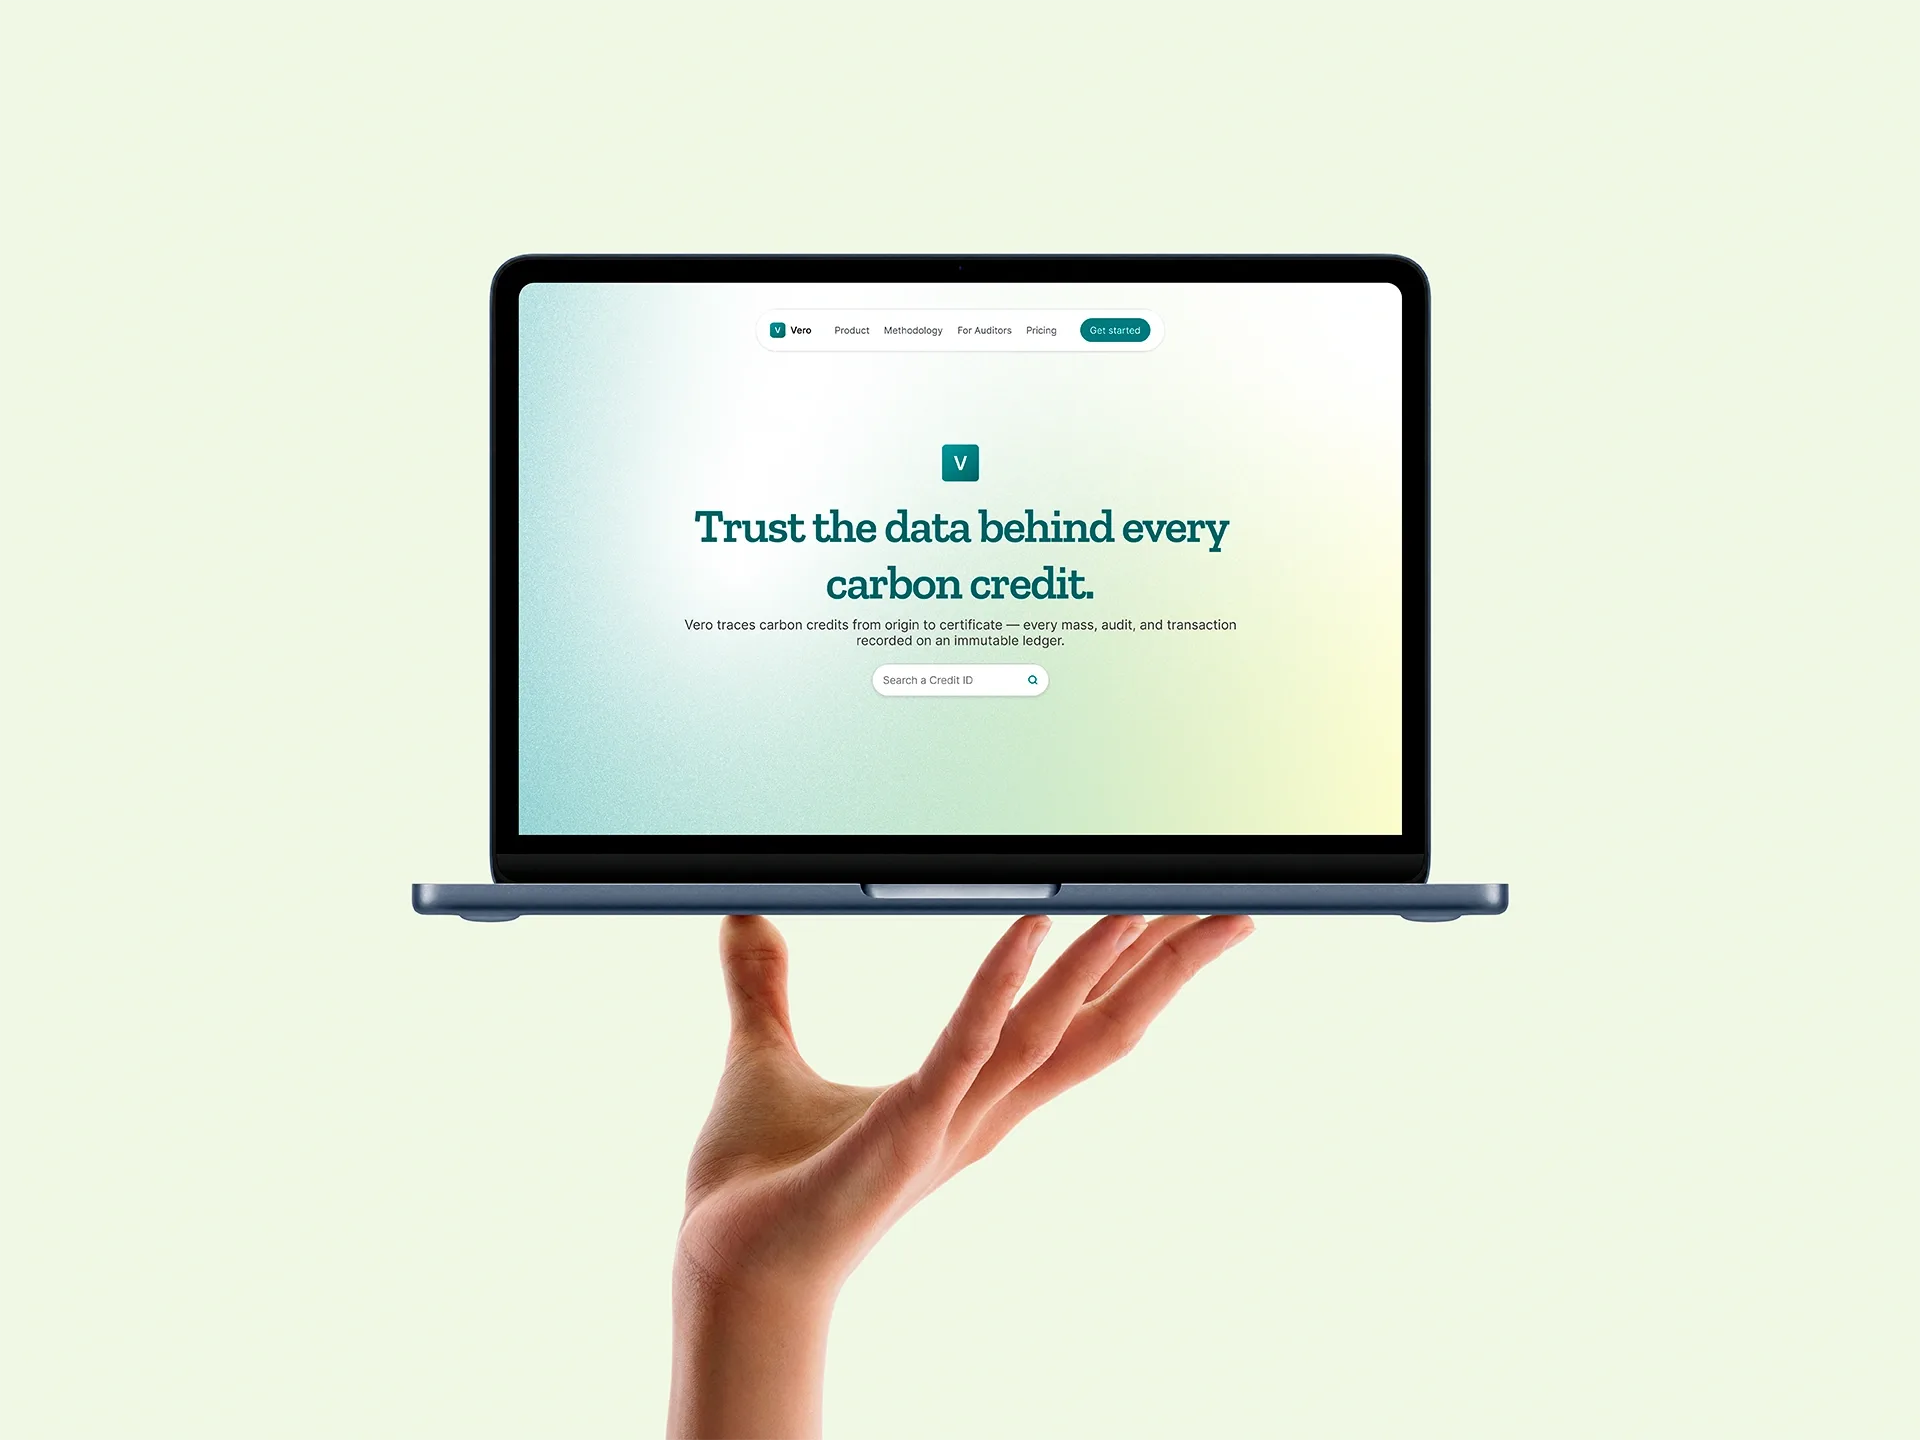
Turning a fragmentedblockchain ledger intoa navigable system.
A carbon-credit traceability portal that buried auditors in disconnected pages was rebuilt around real navigation behaviour — cutting task time by over 50% and lifting journey completion from 57% to 82%. The project is under NDA: the company is referred to here as Vero, and screens, partner names, and data values have been altered or omitted.
Every document opened as an isolated destination rather than a connected step, so users experienced each page as a dead end.
The portal tracked the full lifecycle of a carbon credit — from methodology definition to NFT issuance — across more than 30 interconnected record types. But every record opened full-screen with no persistent navigation. The only breadcrumb showed the literal sequence of pages a user had visited, regardless of how those records were actually related. The paradox was clear: A system built around traceability made it difficult for anyone to trace their way through it.
Auditors kept personal notebooks just to relocate information. Tasks that should have taken minutes stretched beyond two hours, and some users eventually gave up and contacted the internal team instead.
Buyers faced a different problem. They believed in the mission, but couldn’t see what that mission meant inside the product. The underlying data was there, but nothing made the carbon credit feel tangible or owned.
The document structure had effectively become a chain of overlays and breadcrumbs. Users could move forward, but losing their place meant starting over.
“I used to keep my own notebook just to remember where each certificate lived. If I lost my place, I had to start over.”Auditor, partner organization
“I’m always making up new paths to get to the same place, which is very telling: I can see the complexity! The problem is I can never retrace my steps — I need to relearn it every time.”Auditor, partner organization
“I’m a huge fan of the mission but I can’t grasp what buying a credit means. Must I wait for a line of code, or maybe a badge? Like, what is it?”Corporate buyer, early adopter
What we wanted to achieve?
Research prioritized the auditors who got stuck — because their friction revealed the structural problem.
The loudest complaints weren’t necessarily the most useful research signal. Auditors who became stuck in the middle of a task exposed something deeper: the platform’s structure was forcing users to reconstruct relationships from memory. That observation shaped two early hypotheses.
Hypothesis 01
If long records were broken into collapsible sections instead of one continuous block, auditors familiar with certain fields would skip straight to what they needed, cutting both perceived length and review time.
Hypothesis 02
If key identifiers like Tracking IDs and links were copy-enabled by default, auditors would stop keeping external notes altogether, not just navigate faster.
Four principles guided every interface decision that followed.
Folder structures and Notion-style navigation, over novel interactions users would need to learn from scratch.
Not the order pages happen to be visited in — persistent, expandable navigation over a literal breadcrumb.
Group related events visually, instead of relying on timestamps alone to imply order.
Give abstract, data-only assets a visual anchor buyers can point to.
The system supported direct relationships, not a global map.
Two structural constraints shaped the strategy from the outset: 1. Field labels were fixed to system terminology: Some labels could be renamed for clarity; others had to remain exactly as defined by the underlying system. 2. The system only supported direct parent and related-record relationships: A unified global view of the entire relational network was not technically feasible. These constraints ruled out an ambitious “map everything” solution.
Four decisions, four problems.
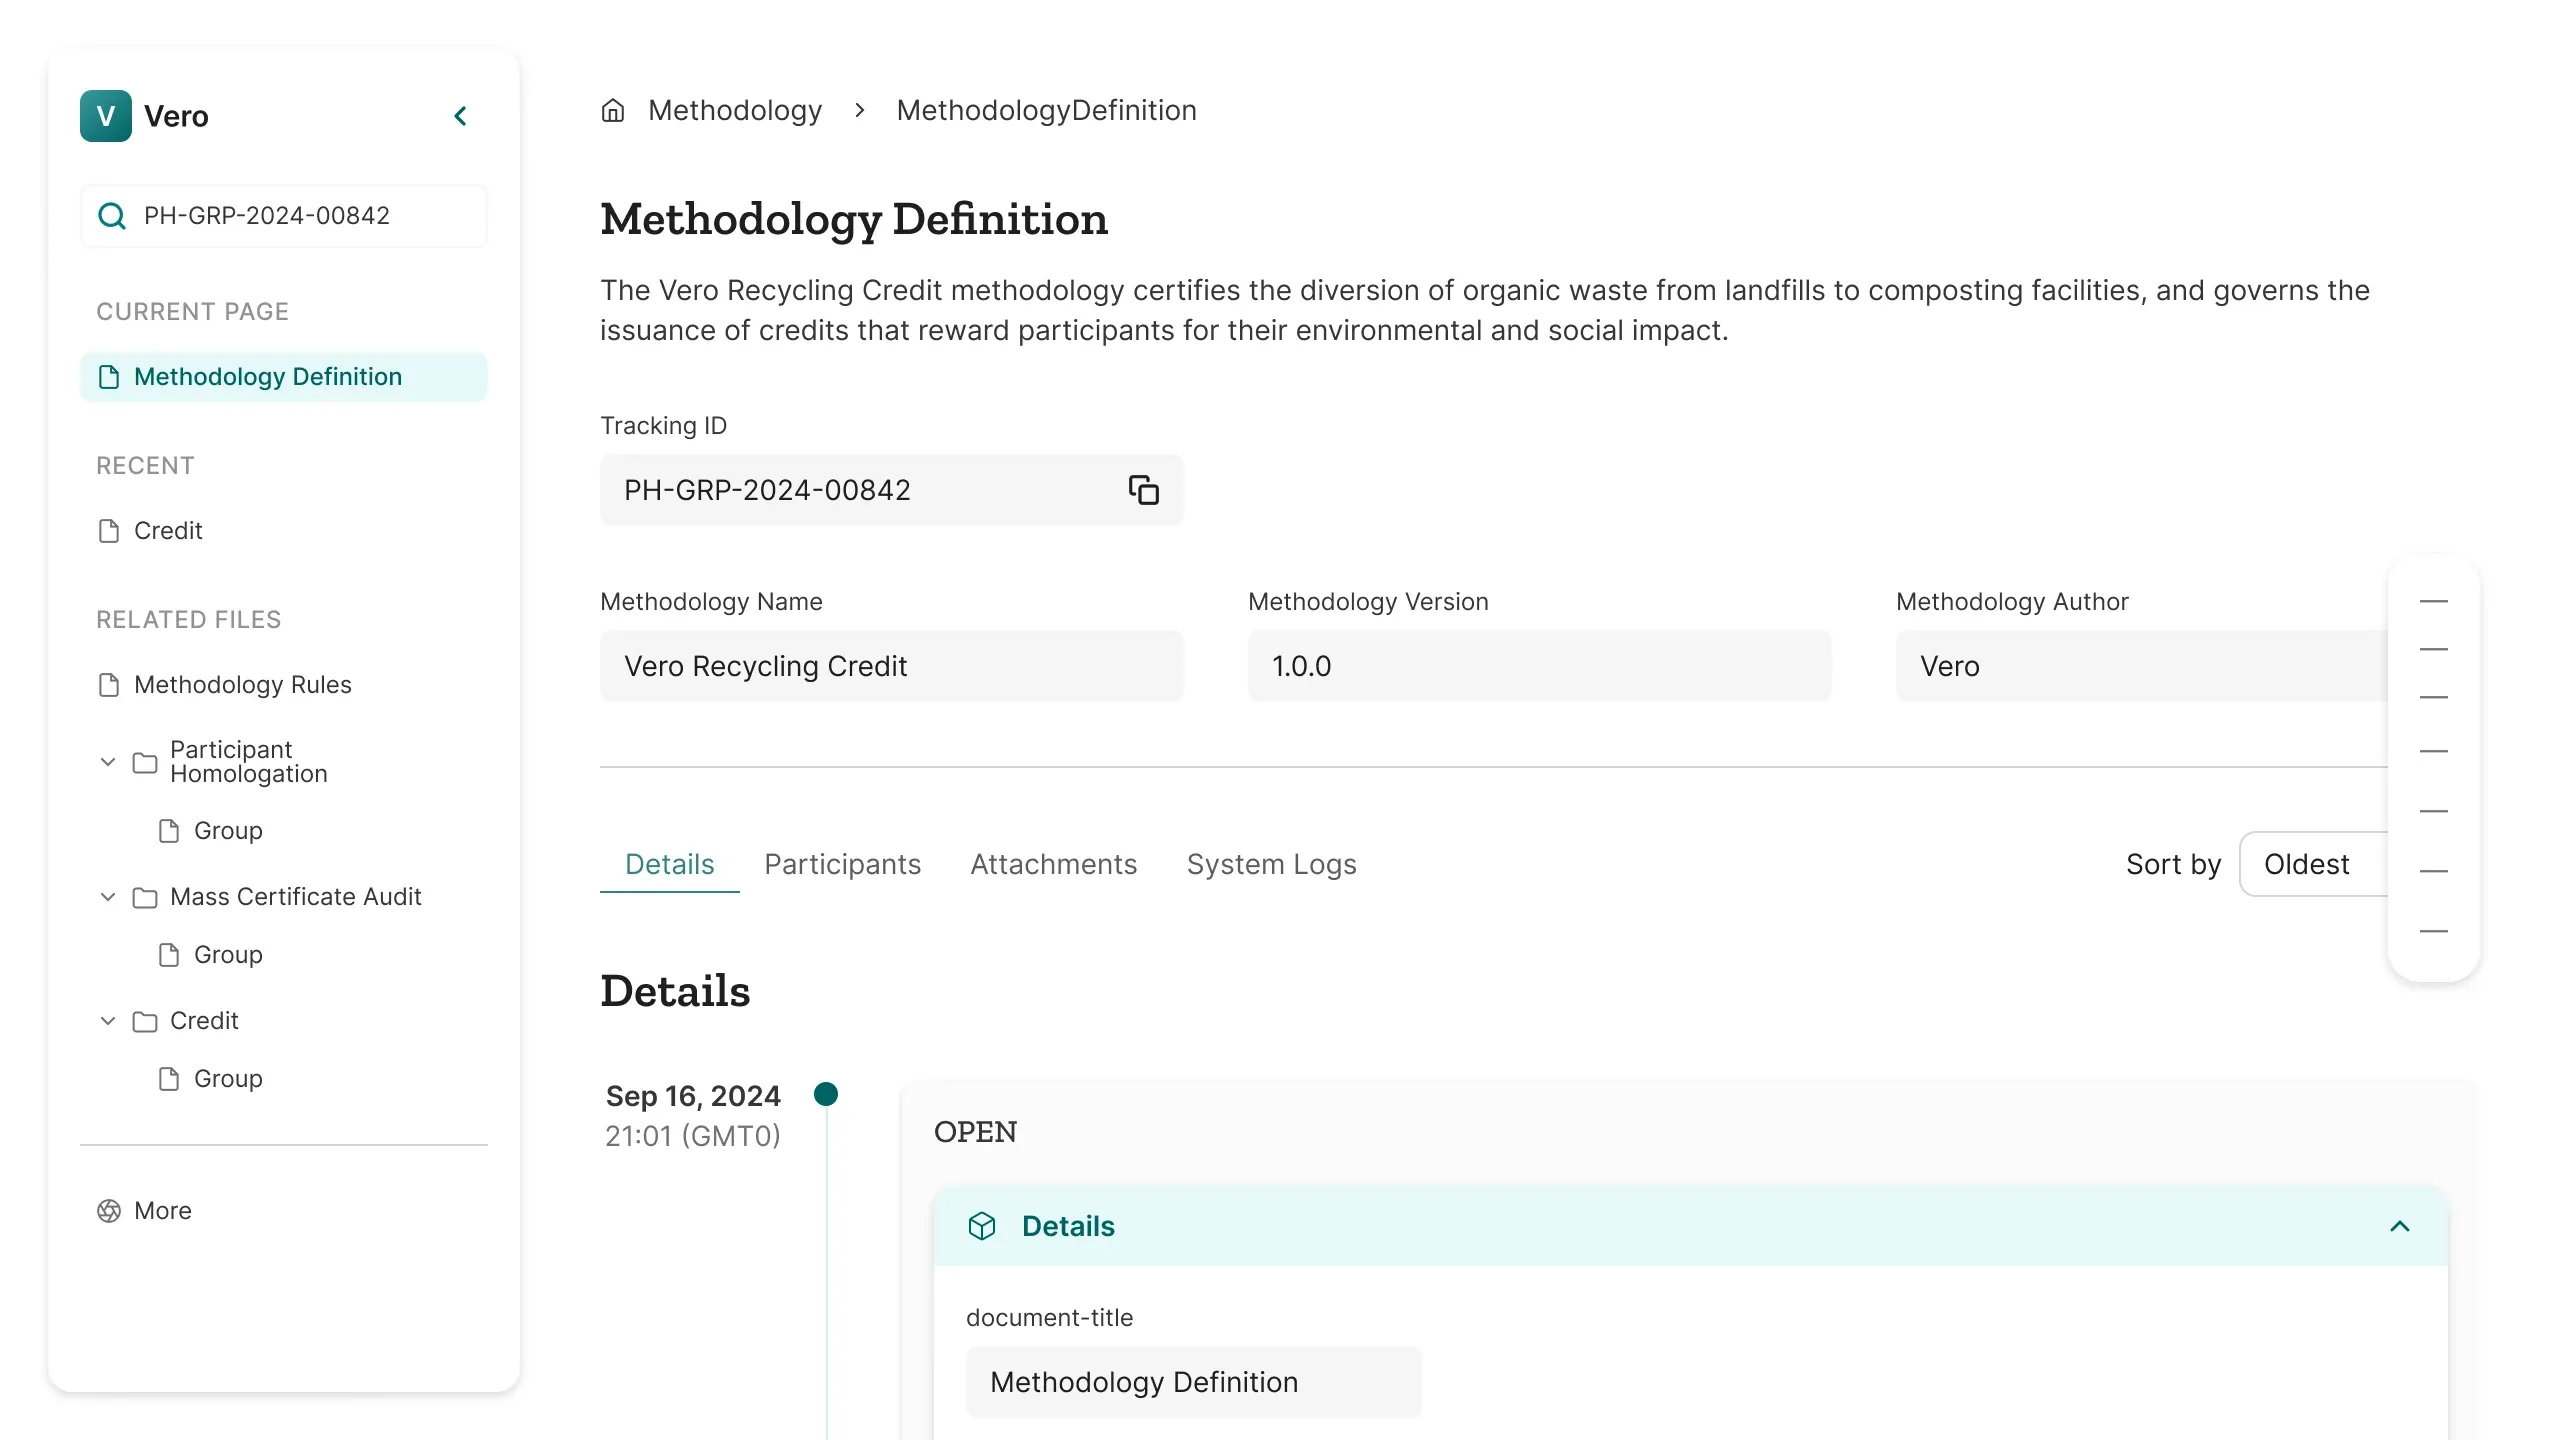
Folder-style navigation
Every document was connected like a web, but the breadcrumb only recorded the order of pages visited.
Introduce persistent left-hand navigation based on a familiar mental model: folder structures similar to file explorers and cloud drives. Related record types remain visible and expandable from any starting point.
Navigation loops disappeared, and auditor session time dropped from 2+ hours to under 1 hour.
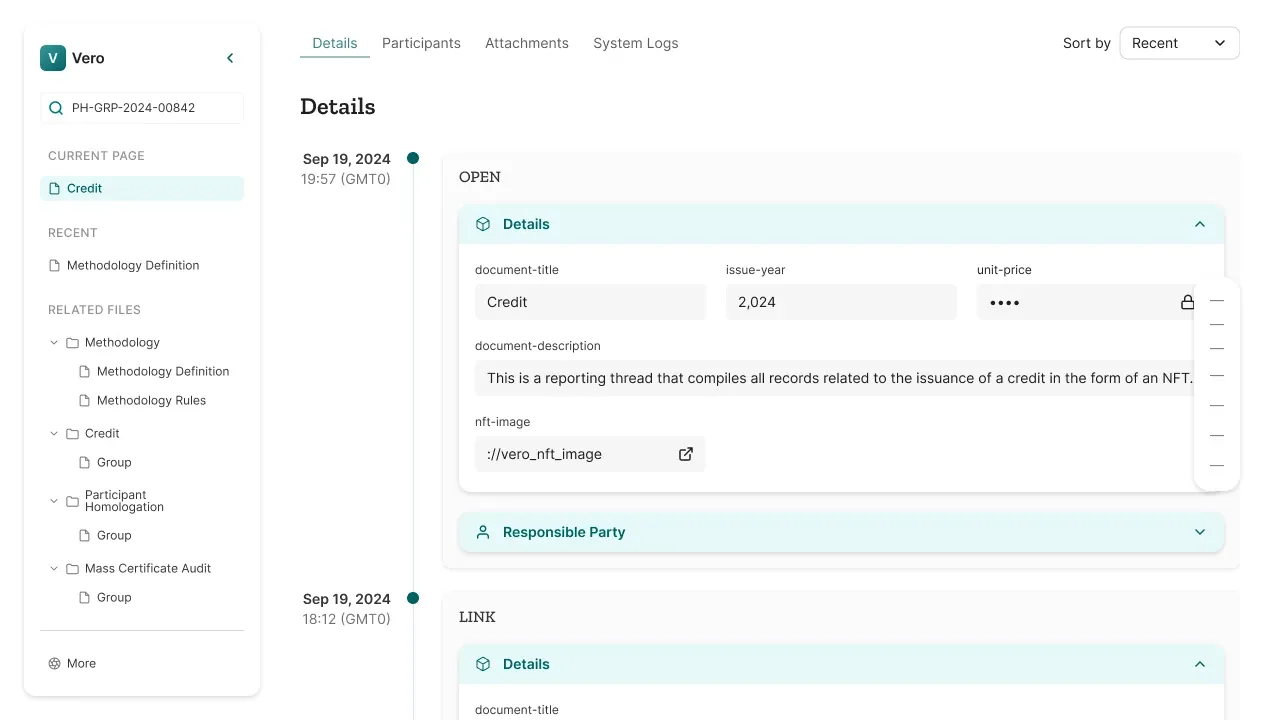
Timeline with nested events and tabs
The original system relied on timestamps alone to imply order — forcing users to mentally reconstruct which event caused which, since nothing in the UI grouped related steps together.
A visual timeline grouping related entries inside soft containers, with a restrained gray/blue/white palette to signal hierarchy with less visual noise. Tabs were added for extra clarity: the timeline contained everything, but if a “Participant” needed auditing, tracking was easier.
Auditors could see the relationship between events at a glance — critical in a system whose value depends on data integrity and traceability.
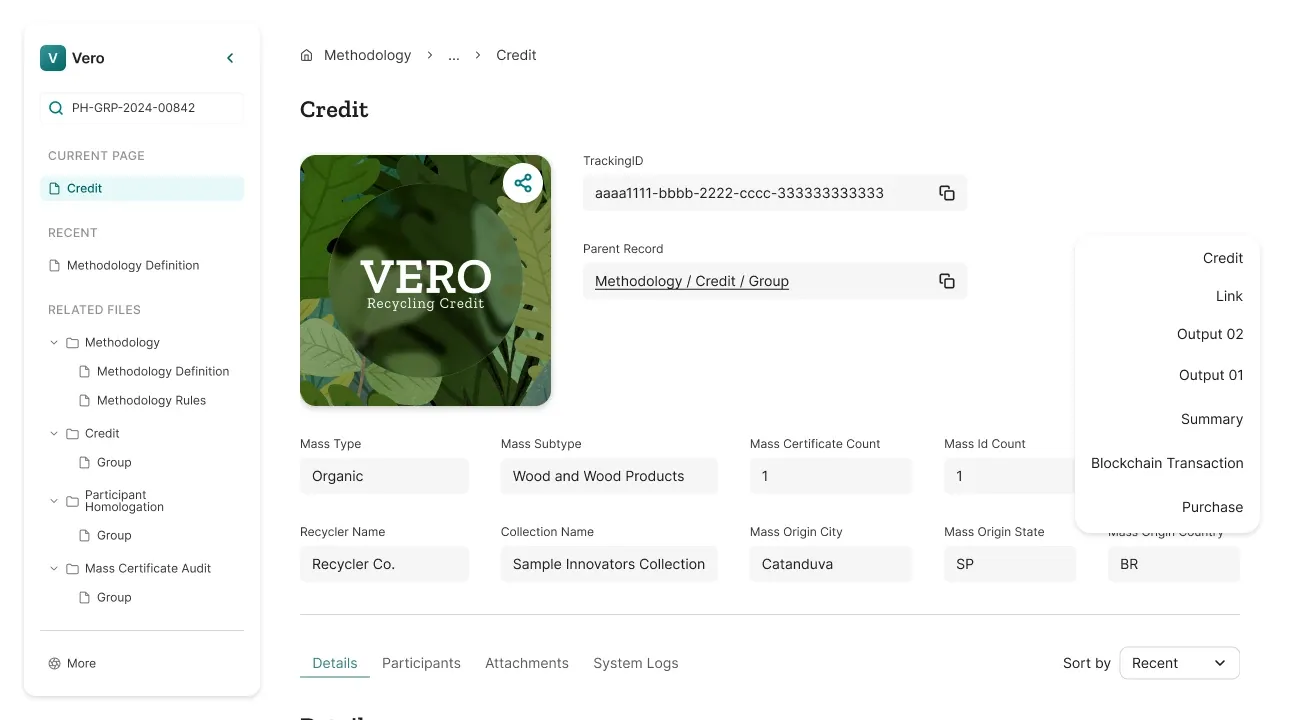
Floating table of contents
Some records contained five sections. Others contained more than 30. Long documents created measurable scroll fatigue and made it difficult to maintain a sense of where the user was within the record.
A floating table of contents, inspired by Notion, letting users jump directly to any section while staying oriented in the larger structure. Notion was chosen deliberately as the benchmark: the goal was a pattern users already trusted from daily tools, not a novel interaction to learn.
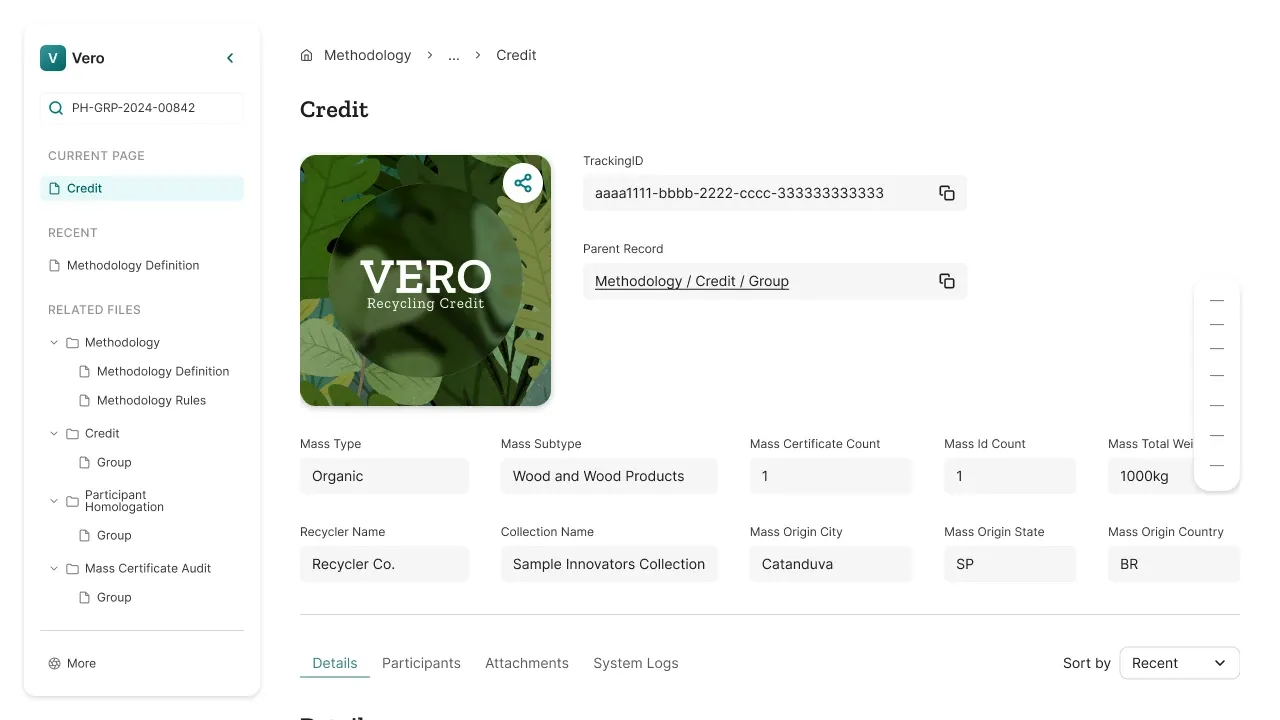
Carbon Credit with NFT artwork
Buyers understood the mission but struggled to understand what they actually owned. A carbon credit is fundamentally abstract: its value is represented through data, records, and relationships rather than something physical a user can see.
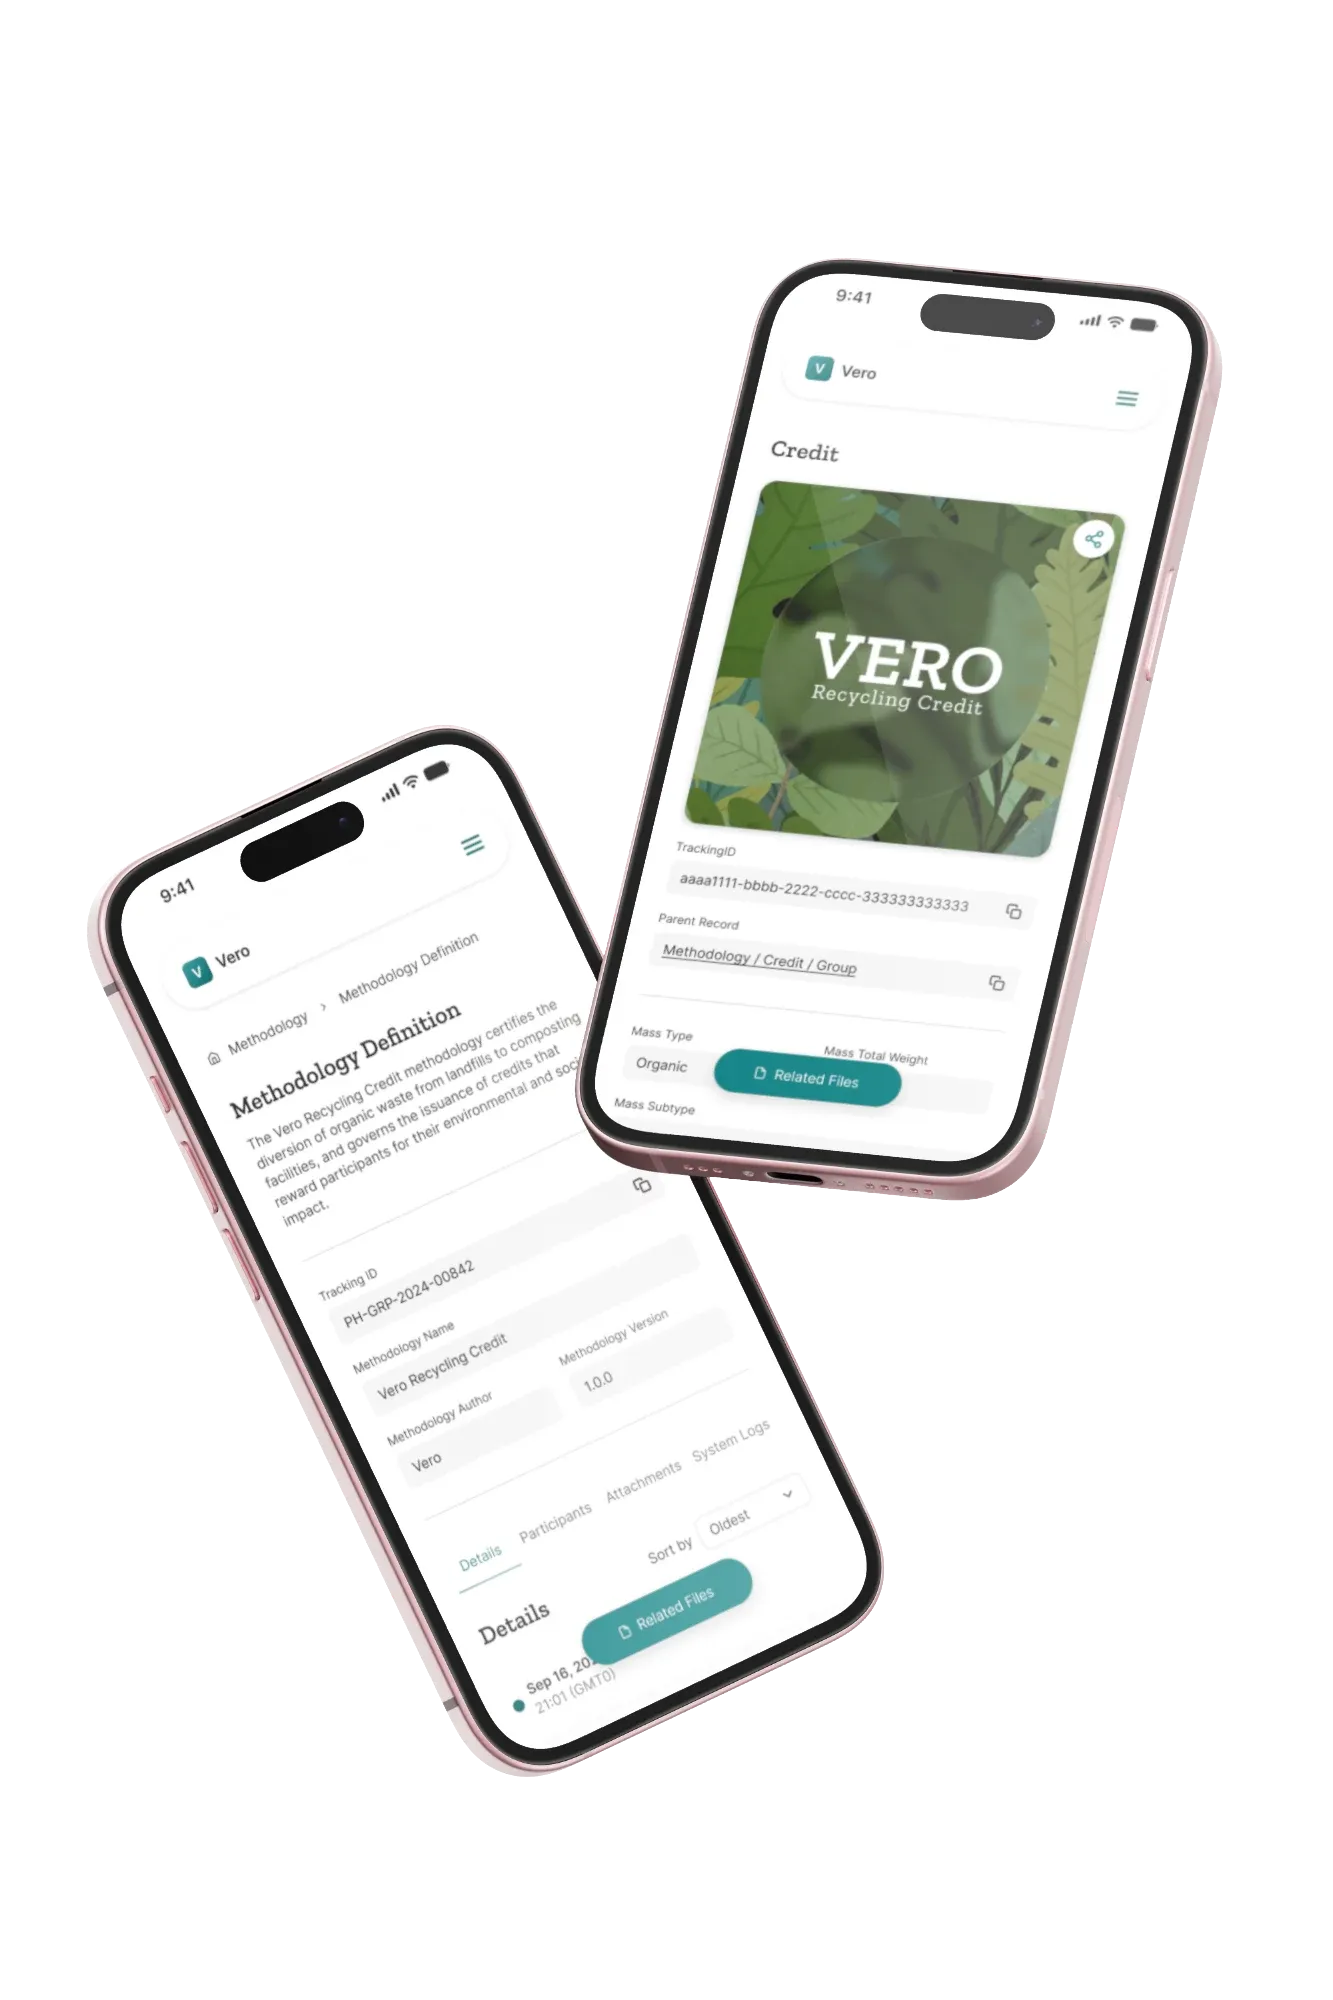
The NFT artwork appears directly inside the Credit record, connecting the technical process — audit, mass, participants — to a tangible visual output. It’s a direct bridge between traceability (trust) and ownership (value): the two things buyers wanted but couldn’t reconcile.
136 components, derived from one set of shared primitives, scaling across two platforms.
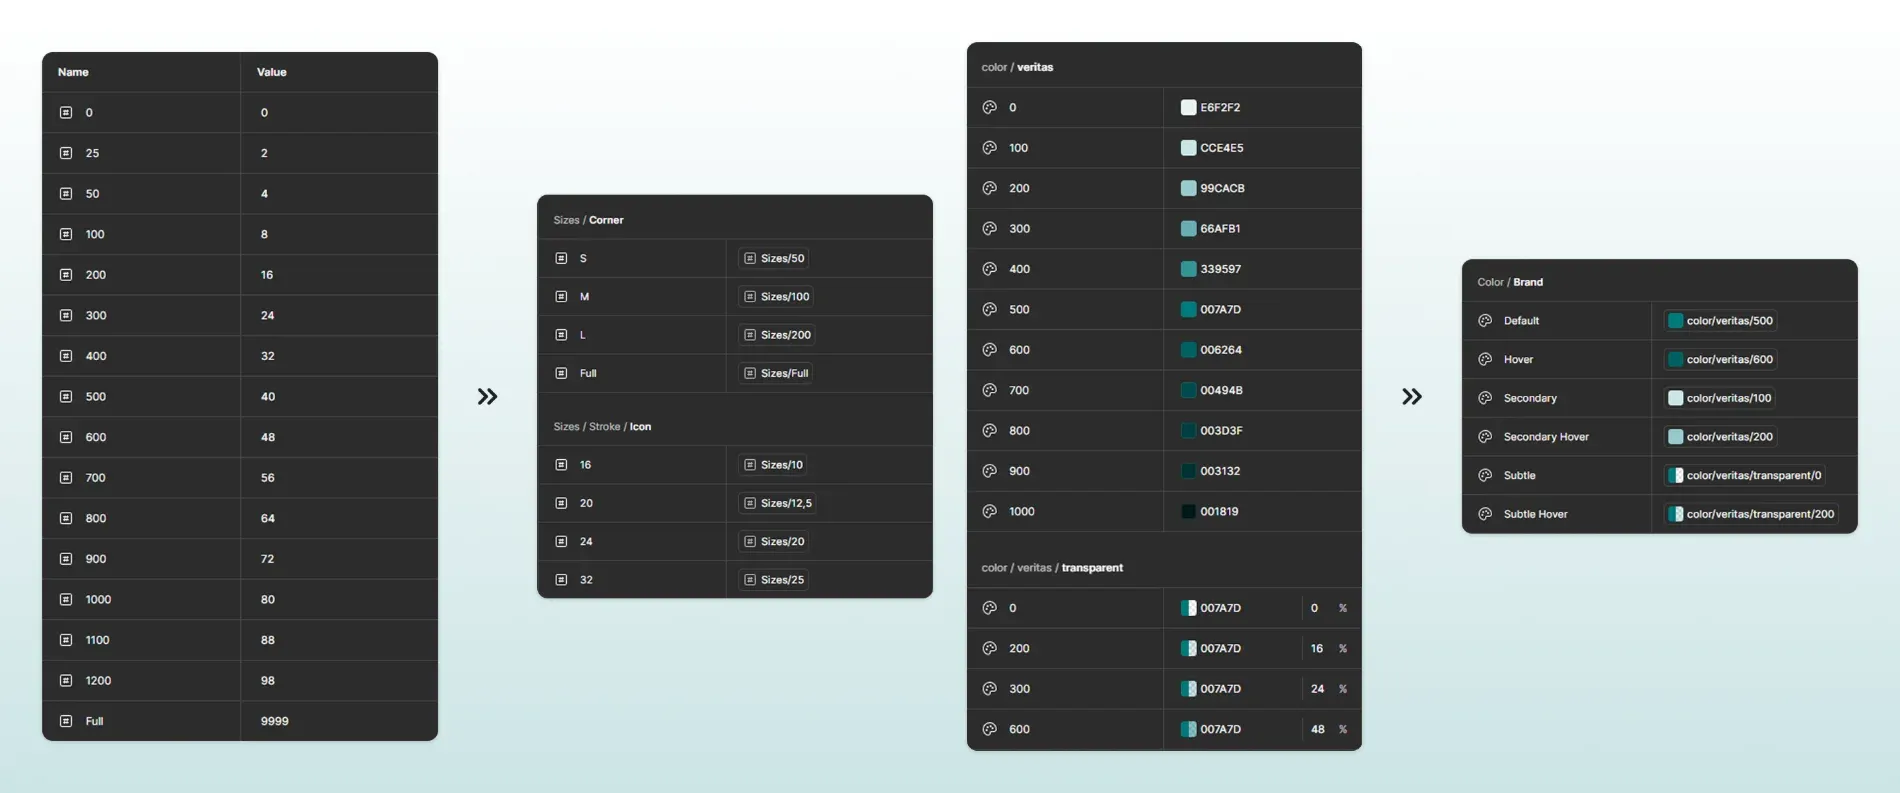
The design system was built entirely in Figma using variants. Typography, spacing, and colour all followed a small / medium / large system, while colour was structured as primitive ramps — 100 through 900 per hue — consumed through semantic variants such as primary, secondary, tertiary, and neutral.
The system was shared across the portal and institutional website. Two platforms. Different contexts. One underlying system. type scale, primitive ramps, semantic variants
Journey completion rose from 57% to 82% once the redesigned structure made traceability navigable on its own.
Validated qualitatively through moderated sessions with auditors who had never used the platform. Using the persistent folder navigation and nested timeline, participants were able to complete the traceability task without onboarding.
Validated qualitatively through buyer feedback after the NFT artwork was introduced into the Credit record. For the first time, buyers could point to what they owned rather than describing the credit as an abstract entry in a ledger.
Auditor task time fell from more than two hours to under one hour. That exceeded the original target of 1h30 by a significant margin.
The numbers already told the story. What’s left is what I’d change — and who made it possible.
The project demonstrated that the biggest usability problem wasn’t necessarily the complexity of the underlying data. It was the mismatch between that complexity and the mental model presented to users. Once navigation reflected the actual relationships in the system, the complexity became something users could move through rather than something they had to remember.
Instrument analytics from day one, so the 57% → 82% metric didn’t rely solely on moderated sessions · document methodology-type variation earlier, since navigation assumed a uniform structure that may not hold at scale · push harder for different views and profiles across all 3 personas · push earlier for copy-enabled identifiers, instead of discovering that gap only through auditors’ manual note-taking workaround.
“The system — not any single screen — is what let one designer ship a complex concept in such a short time.”Closing thought