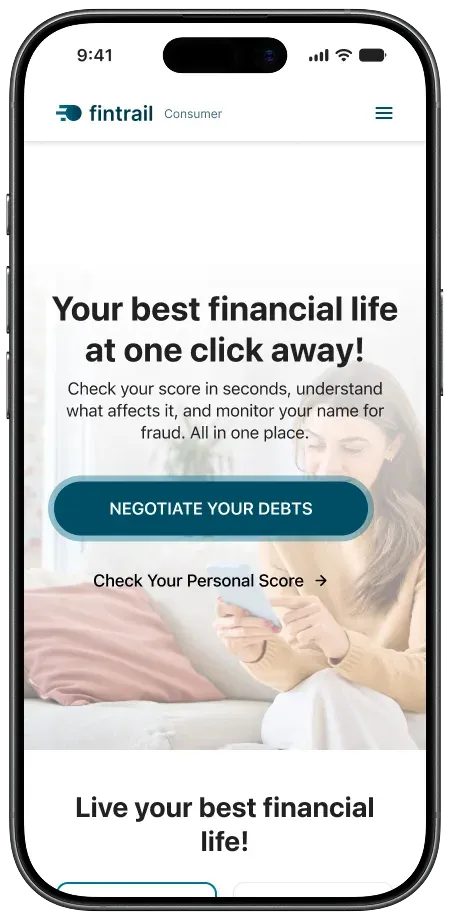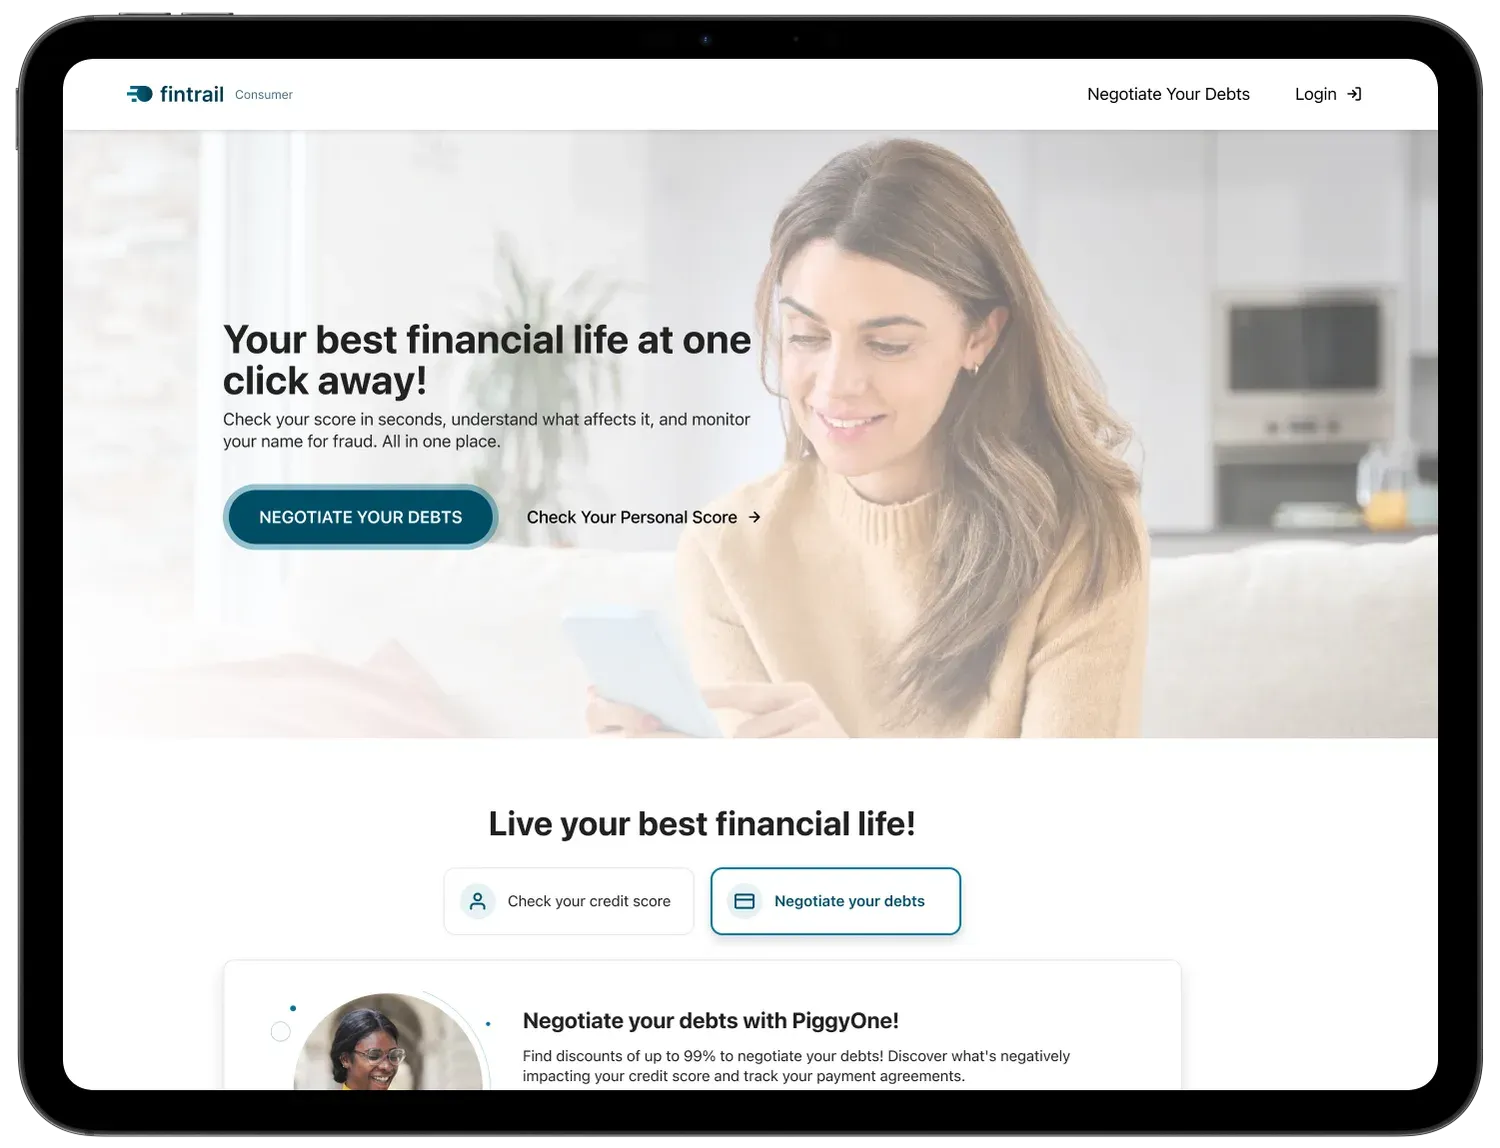
Understanding debtshouldn’t feel likean interrogation.
A self-service redesign for Fintrail, a joint-venture credit portal. I used support-ticket data and UX research to turn a confusing debt experience into a clearer path from information to action. Company name and identifying details have been changed under NDA.
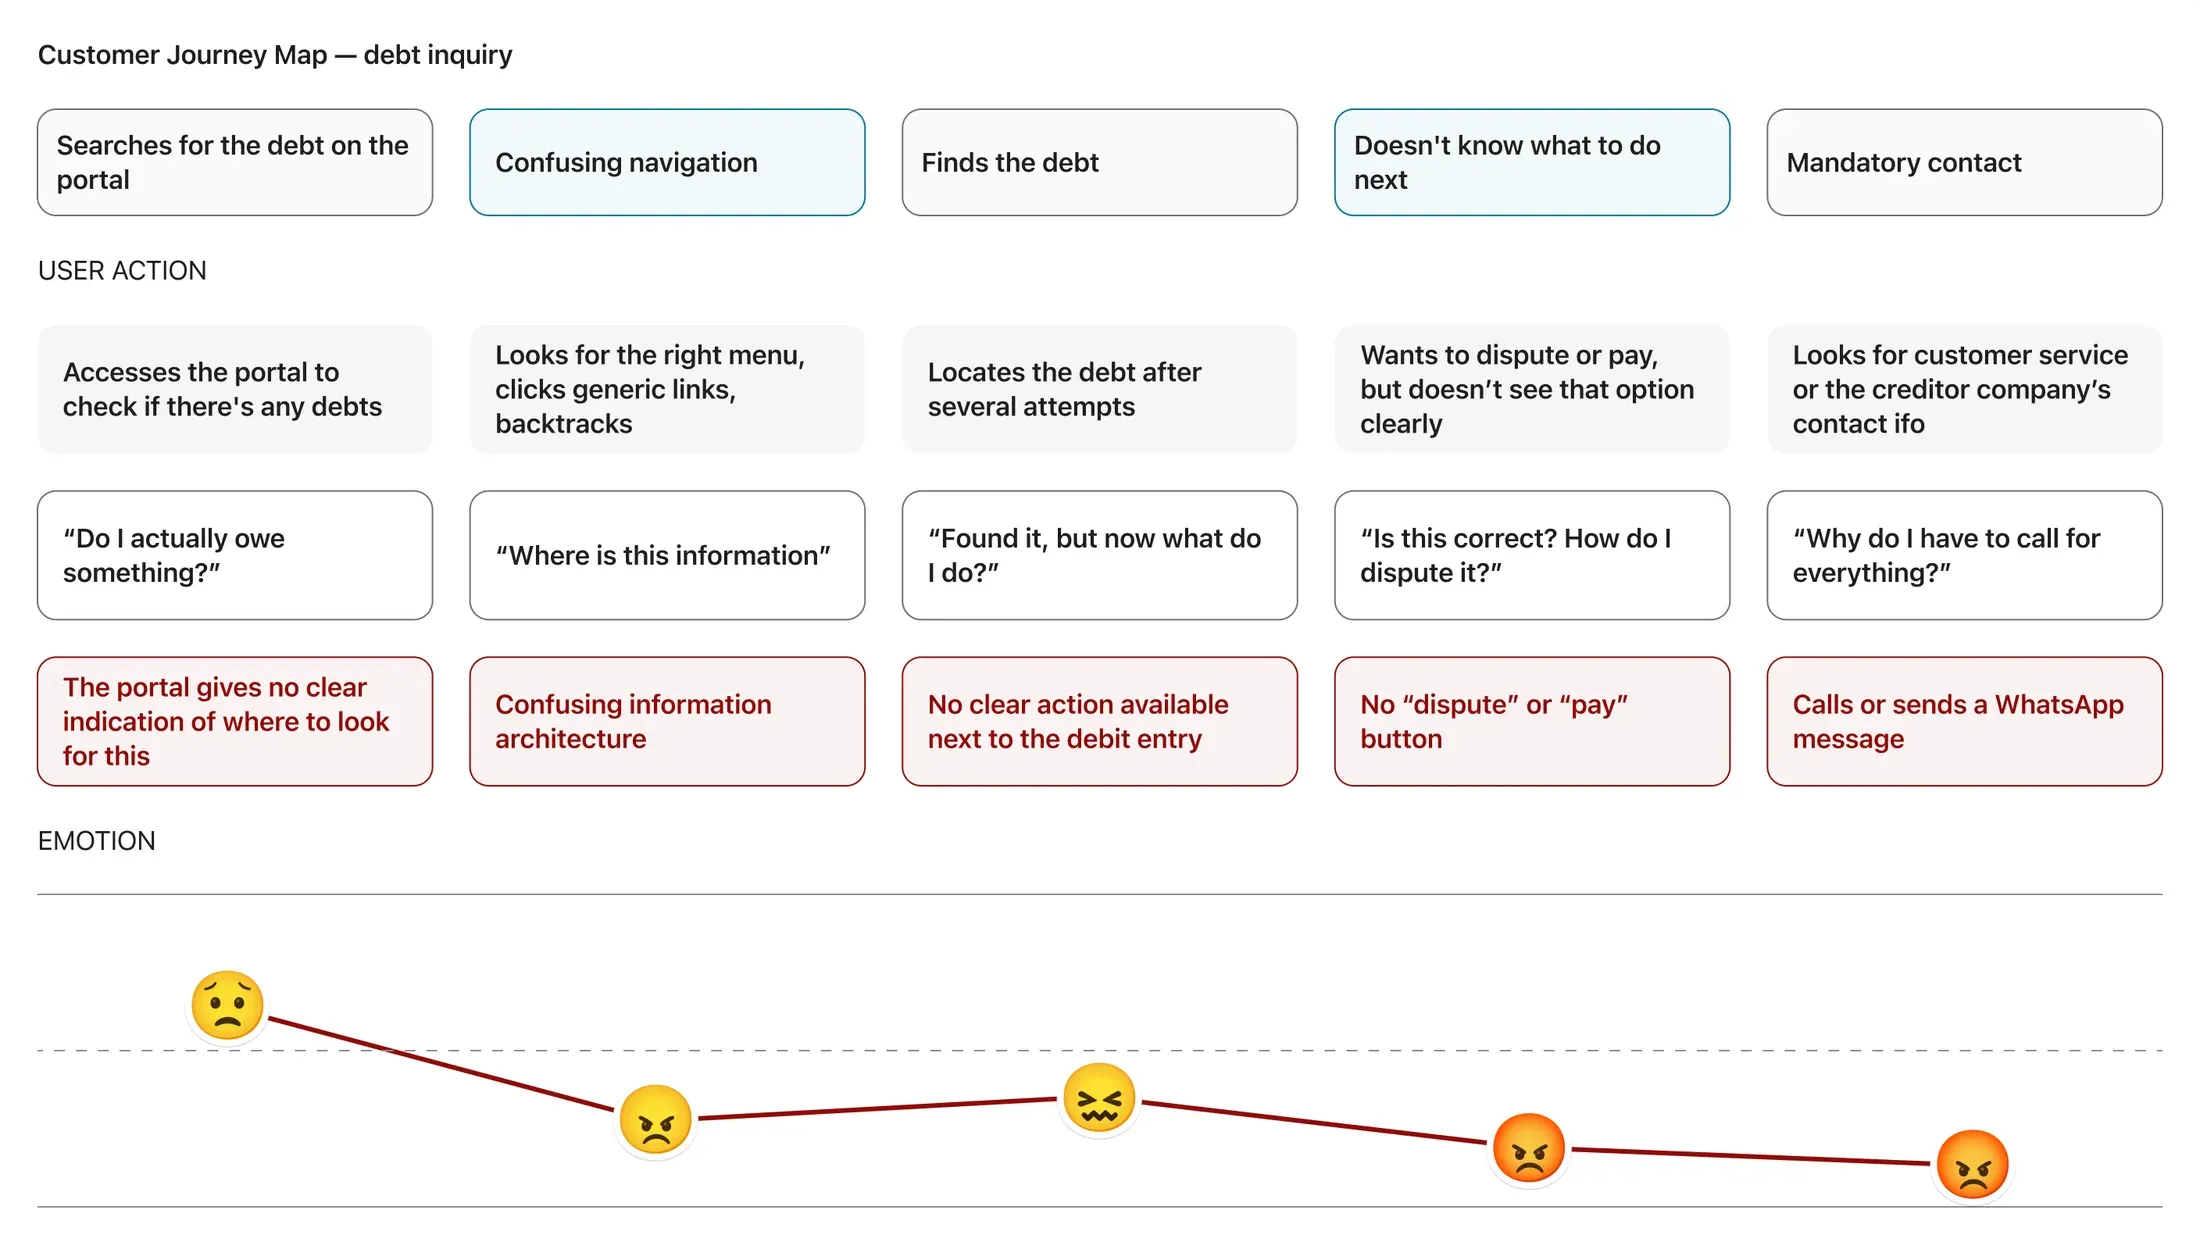
People didn’t know if they owed money, who to pay, or why the number on screen kept changing.
Fintrail’s users weren’t confused about money in the abstract. They were confused about their own money — a debt tied to a partner company most had never directly interacted with. Sometimes the debt had already been paid, and they still couldn’t work out why it was on screen — flooding support with questions that should never have needed asking.
The portal showed numbers, but rarely explained where they came from, what they meant, or what to do next. When something didn’t apply to a user, it simply disappeared. No explanation, no empty state and no context. In a financial product, unexplained information doesn’t feel neutral. It feels like something is being hidden.
“Apparently I have a lot of debt with UniBank. I can’t reach them or pay anything here. What do I do with this information?”Support ticket, B2C segment

This wasn’t simply a UI redesign — five forces pulled in different directions.
Every proposed solution had to work across five constraints. Users needed clarity. The business needed to reduce support costs without a dedicated development team. Compliance required careful handling of debt and identity data. Engineering had no funded squad yet. Legal needed any change to remain within existing partner agreements.
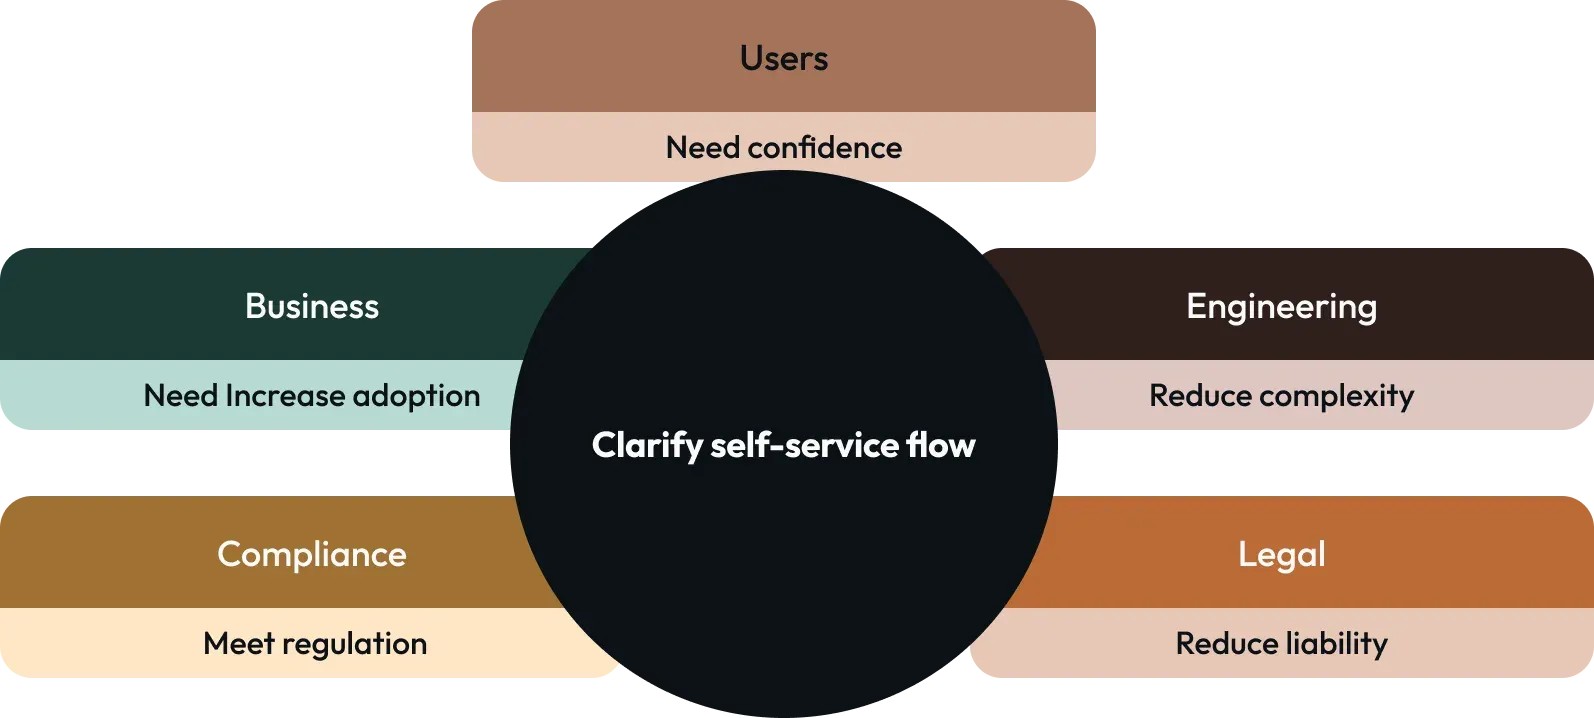
A better screen wasn’t enough. The design question became: What is the smallest change that meaningfully improves the experience without breaking any of the constraints around it?
Support data and portal behaviour showed where the journey broke — and why.
Starting with the evidence closest to the problem: 5,000 support interactions across chatbot, forms, and phone transcripts. Grounded Theory codification revealed recurring questions and failure patterns.
After pairing those findings with a heuristic analysis of 100+ web and mobile screens to understand where the interface was creating — or failing to resolve — those questions, I reached two connected issues:The logged-out contact form invited users to bypass self-service andthe interface hid information instead of explaining its absence.
The portal explained neither the debt itself nor the logic behind what users could see. Even positive information was presented without context. Users were looking at numbers about their own financial situation without a clear explanation of what those numbers meant or what they could do with them.
Three principles turned discovery into direction.
Users were being asked to make decisions about information they didn’t understand. Every meaningful action now starts with a plain-language explanation of what the user is looking at and why it matters.
When a section silently disappeared, users couldn’t tell whether it was unavailable, empty, broken, or simply hidden. Instead of hiding system logic, the interface now explains it. Even an empty section has a reason.
Information without a next step creates another question — and often another support ticket. Every important piece of information now points somewhere useful: understand it, verify it, act on it, or contact the right partner.
The interface became a consequence of how information was strutured — not the other way around.
Before redesigning individual screens, I changed the underlying information hierarchy. The first question was not “What should this page look like?” It was: What does the user need to understand first, what context do they need, and what can they do next? That meant surfacing the information that had previously been buried, explaining why information was present or absent, and giving every important state a clear next step.
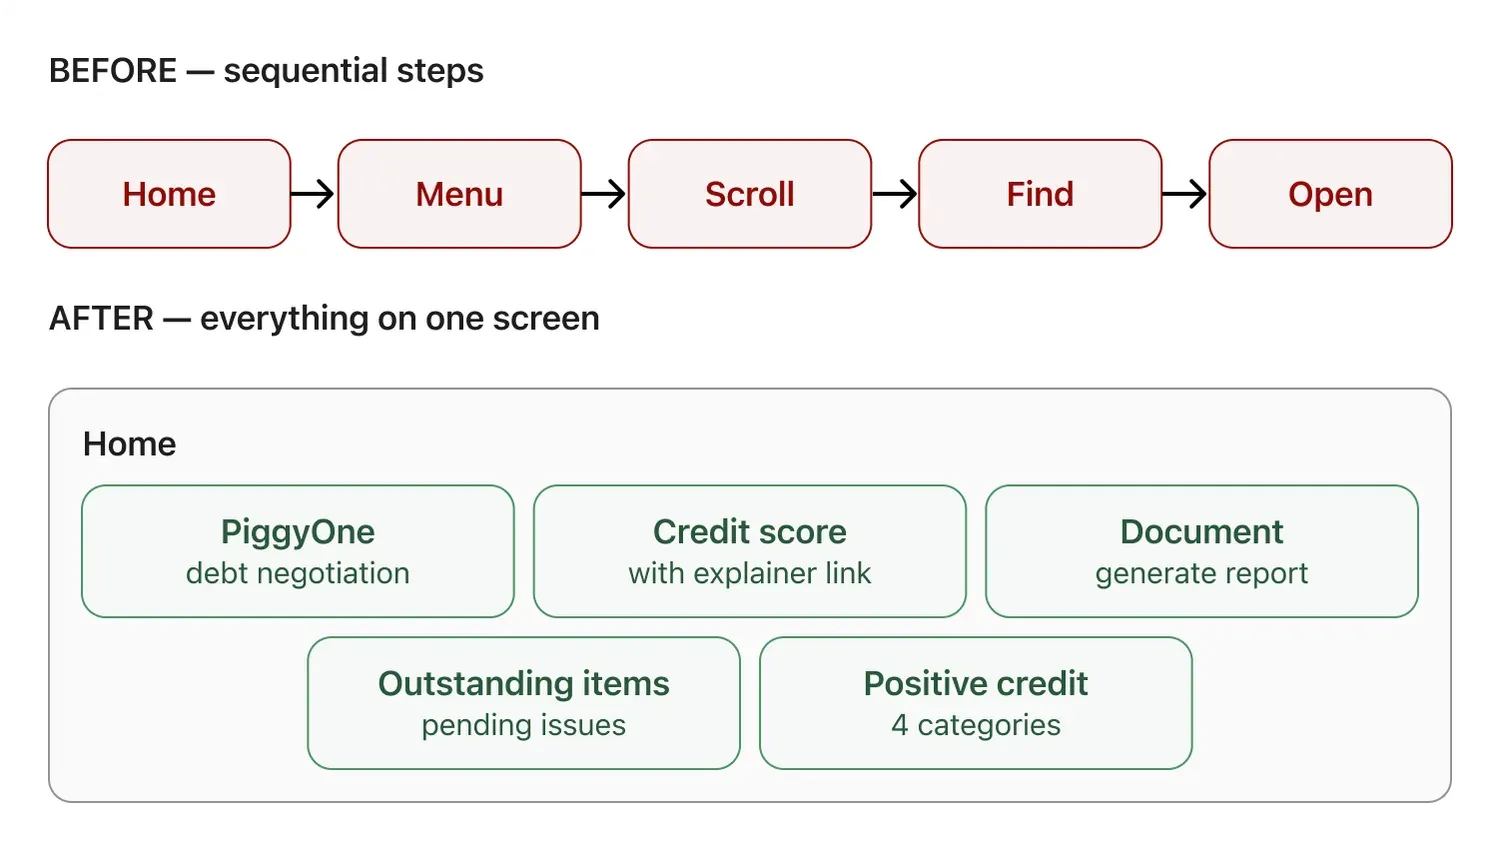
Progressive disclosure replaced silent system logic. Instead of removing sections when they had nothing to show, the new experience keeps the structure visible and explains what is — and isn’t — available.
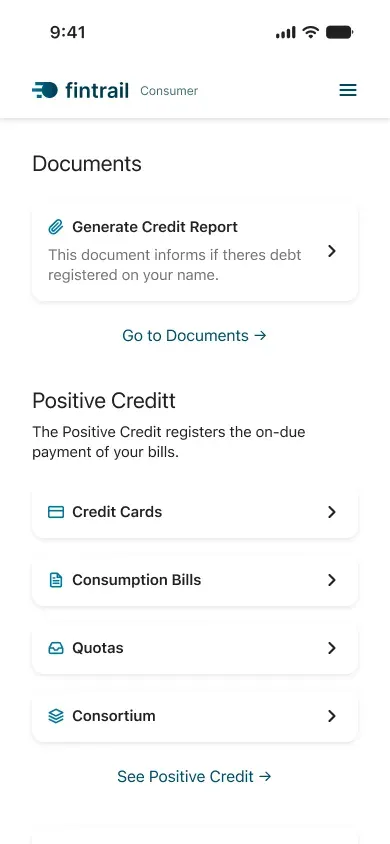
Before, the logged-in home screen was dominated by a single credit-score gauge and positive registry history, outstanding items, and the PiggyOne partnership were buried behind a menu. After, all five areas are surfaced on the home screen, each with a clear path forward. The score itself also gained context: rather than presenting a raw number, the experience explains what it represents and why the user should care.
Three screens, three decisions.
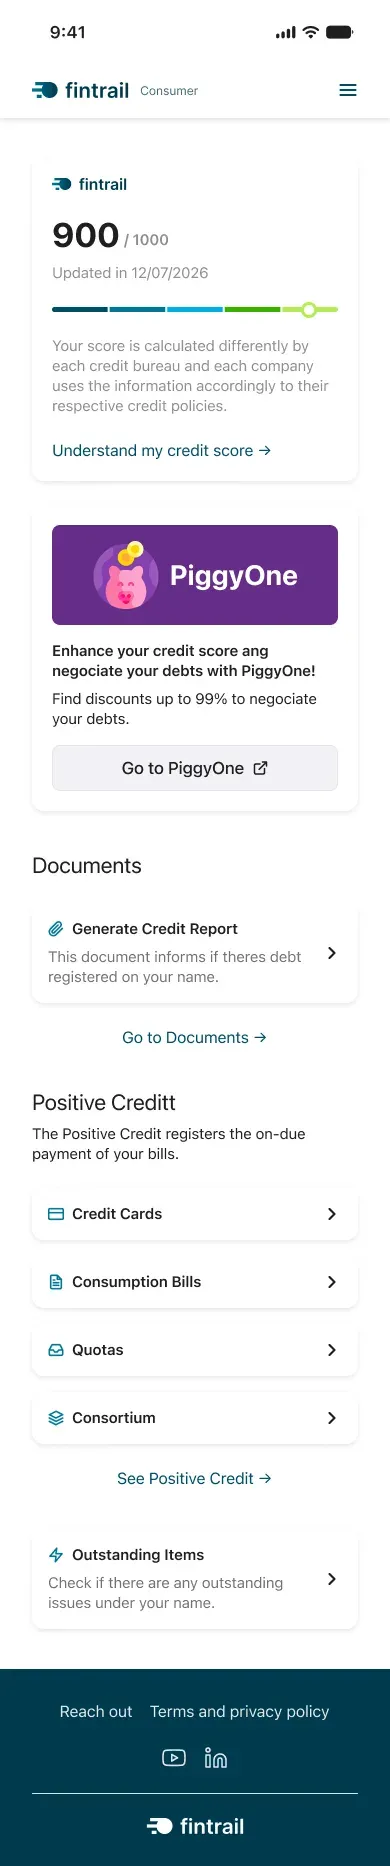
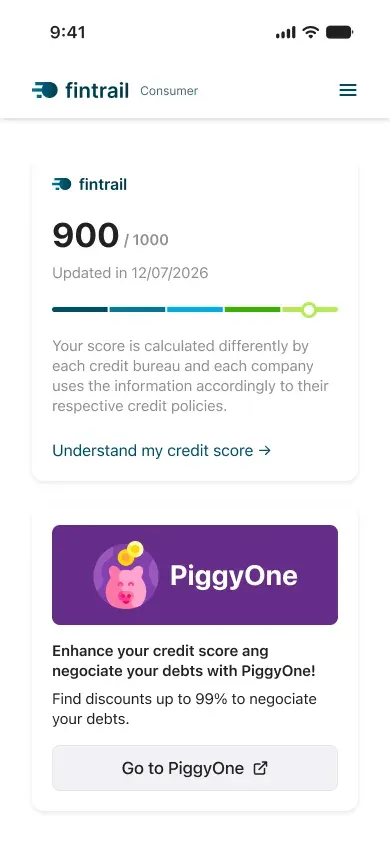
Home, logged in
It is the first thing a user sees on signing in. Before, the home was a single score — a number with no explanation. If a user had nothing on file, the screen was just that number, and empty space.
Turn the home screen into an overview of the user’s situation rather than a single metric. The five core areas are visible from the start, so users can understand what information exists and where to go next without searching through navigation.
Users can immediately understand what the portal knows about them, what their score means, and where each piece of information leads.
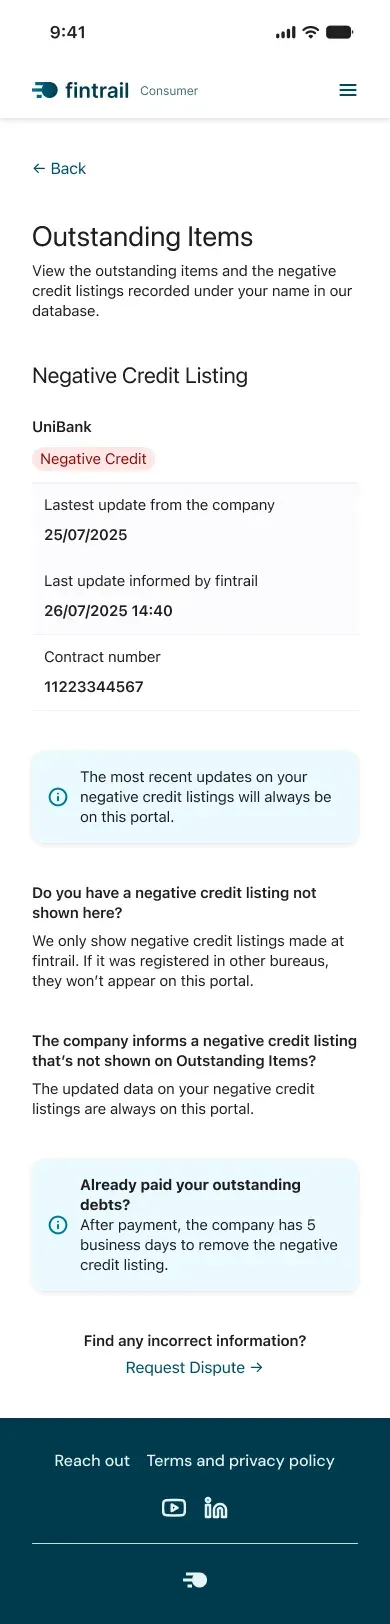
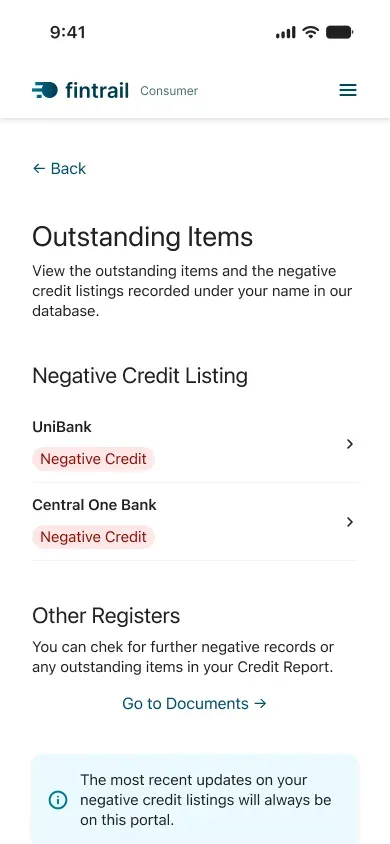
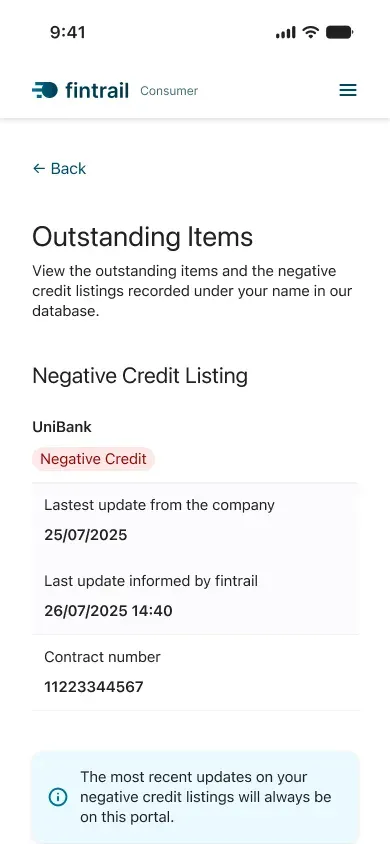
Debt detail
It answers the single most common support question — “what is this, and why do I have it?” Debt information arrived without context, which drove repeat contact.
Clear signposting on every entry: what the debt is, why it exists, and what to do with the information. If it needs paying, the screen routes the user to the joint venture that owns it.
Users can understand and verify their situation before deciding what to do — without needing to call support simply to make sense of the information.
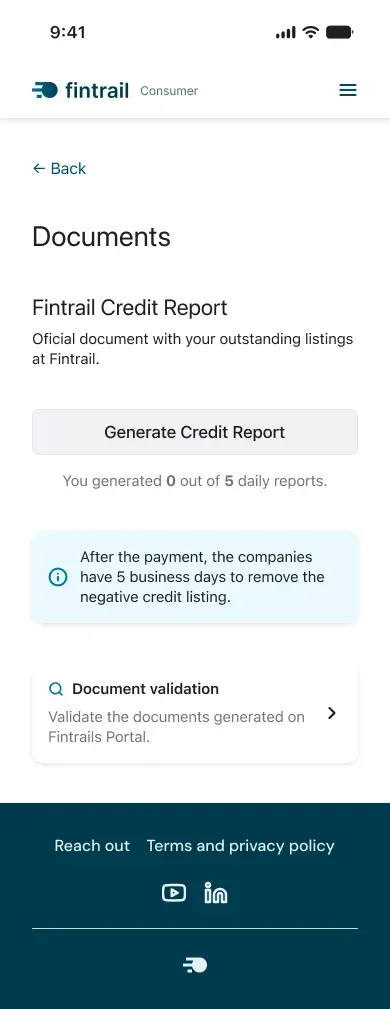
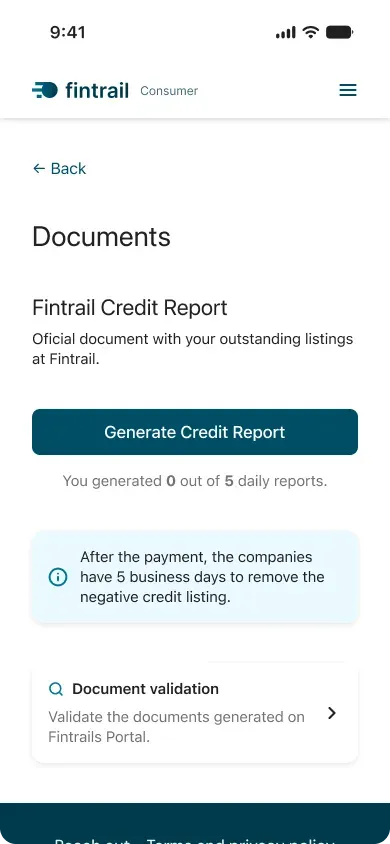
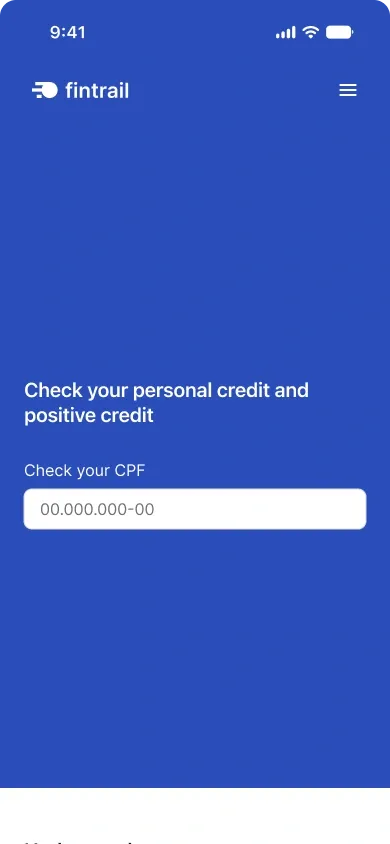
Credit Report
Requesting a credit report used to be fully manual, on a three-day SLA, routed through calls or messaging apps. A document people needed in order to understand their own situation was gated behind human handoffs.
Automated generation inside the portal: the user signs in, sees that the report is available, generates it instantly, reads what they need, and gets on with their day.
The report becomes part of the self-service experience rather than another support workflow. And when something raises a question, the report identifies which company the user should contact.
Three months after launch, support volume was still 69% lower — and the numbers moved well beyond tickets.
The goal wasn’t a prettier interface. It was a product that made financial information easier to understand, verify, and act on — while reducing unnecessary operational work.
That translated into approximately $62k in average monthly B2C support cost eliminated at the root. The reduction continued to hold three months after launch rather than appearing as a short-lived launch effect.
Partner routing time decreased 74% (12.3s → 3.2s). Sessions routed to the credit partner increased 467% (203 → 1,184 sessions)
Users can now verify a debt without calling anyone. A dispute that used to require a phone call now takes three short steps. Credit report requests, previously 100% manual on a 3-day SLA, are now generated instantly inside the portal.
Support data is underused UX research — and it can shape what gets designed next.
This case became the starting point for a formal continuous-listening process between teams that were too far apart: engineering, product, design, and support. Design became not only the enabler that solved user pain points, but also a medium between areas.
I would formalise the support-data-to-design pipeline earlier. The people closest to recurring user friction — especially support agents — often hold research insight that never reaches the design process. In this project, bringing that evidence into discovery made the solution stronger for both users and the business. If I ran it again, I’d make that connection a continuous practice from the beginning rather than a one-off research input.
Financial products shouldn’t simply expose information. They should help people understand it.Closing thought