Turning a fragmented blockchain ledger into a navigable system
A carbon-credit traceability portal that buried auditors in disconnected pages was rebuilt around real navigation behaviour — cutting task time by over 50% and lifting journey completion from 57% to 82%. The project is under NDA: the company is referred to here as Vero, and screens, partner names, and data values have been altered or omitted.
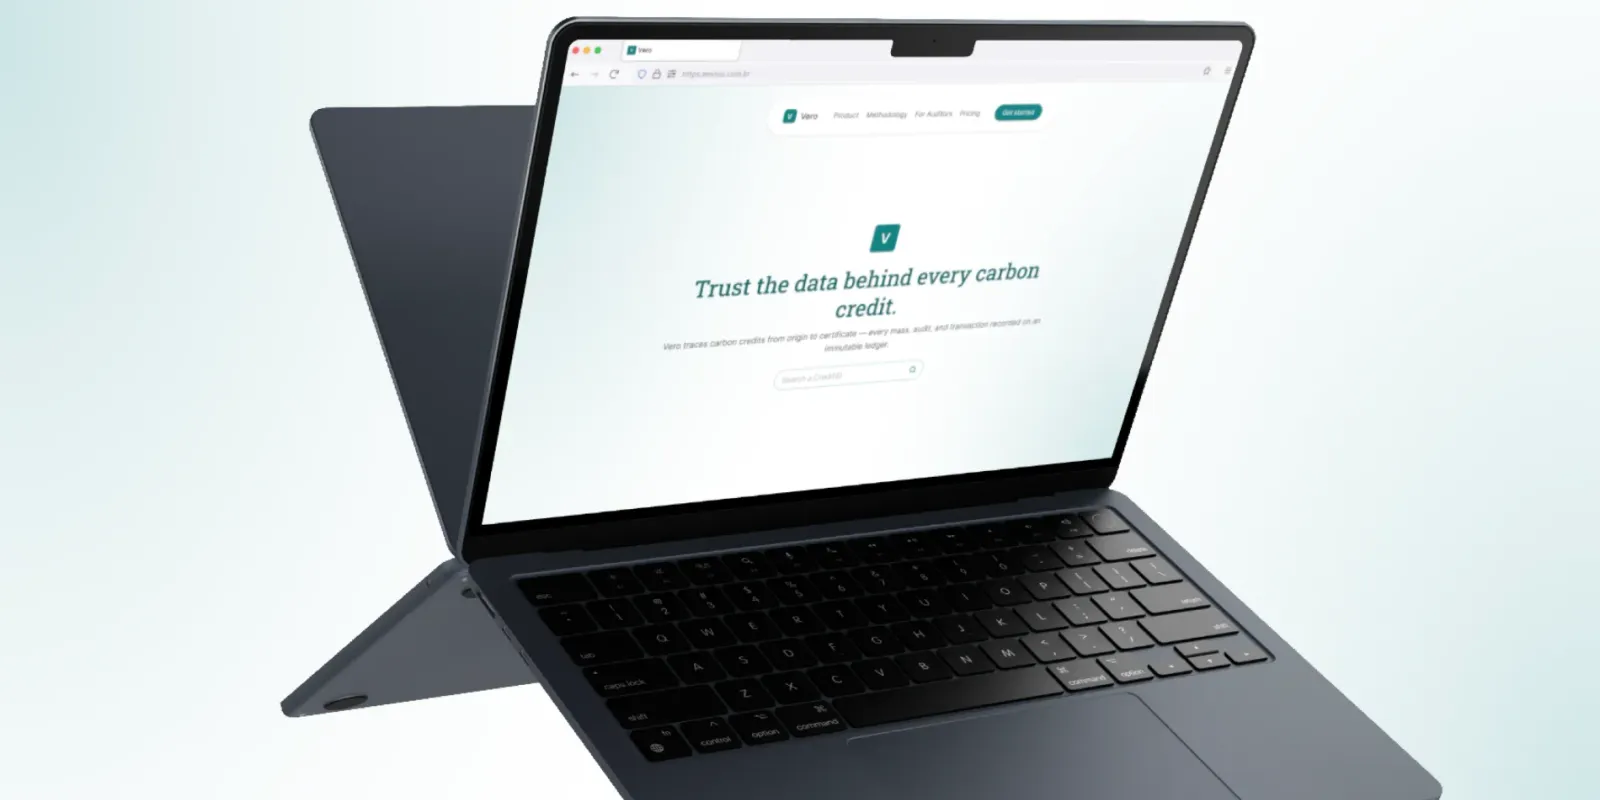
NDA notice
This project is covered by an NDA — this case study covers process and decisions, not real screens or company data. Company name, partner names, and all data values shown are fictional and used for illustration only.
The problem
Every document opened as an isolated destination rather than a connected step, so users experienced each page as a dead end.
The portal tracked the full lifecycle of a carbon credit — from methodology definition to NFT issuance — across 30+ interconnected record types. But each record opened full-screen with no persistent navigation, only a literal breadcrumb of pages visited, regardless of the record’s true structure. The result was a paradox: a system built entirely around traceability that nobody could actually trace.
Auditors kept personal notes just to relocate information, and sessions that should have taken minutes stretched past two hours; many gave up and contacted the internal team directly instead. Buyers, meanwhile, believed in the mission but couldn’t see it in the product — the data was there, but nothing made the credit feel real or owned.
The company had threaded the whole document structure with a breadcrumb, opening overlay on top of overlay. The journey always ended up back at the beginning, and users always lost their way.
"I used to keep my own notebook just to remember where each certificate lived. If I lost my place, I had to start over."
Auditor, partner organization
"I’m a huge fan of the mission but I can’t grasp what buying a credit means. Must I wait for a line of code, or maybe a badge? Like, what is it?"
Corporate buyer, early adopter
"I’m always making up new paths to get to the same place, which is very telling: I can see the complexity! The problem is I can never retrace my steps — I need to relearn it every time."
Auditor, partner organization
My role
What I owned, and who I owned it with.
Scope
I led UX/UI design end-to-end across a Web3 portal and an institutional website, working alongside a research-focused designer and a rotating engineering team — in a fast-moving startup environment with no room for dedicated research or wireframe-to-prototype cycles.
Deliverables
Full portal redesign (blockchain traceability for carbon credits) · institutional website redesign · a token-based design system of 136 components · support for 3 personas: auditors, corporate buyers, marketplace participants.
Goals
Cut auditor task time from 2+ hours to under 1h30 · make traceability legible without prior platform knowledge · make an abstract asset — a carbon credit — feel tangible.
Discovery
Research prioritized the auditors who got stuck in the flow over the ones complaining: their friction revealed the real structural problem.
Two insights shaped the direction early on. The first: auditors who got stuck mid-flow — not the ones who complained loudest — were the ones revealing the real structural problem. That led to a hypothesis: if long records were broken into collapsible sections instead of one continuous block, auditors familiar with certain fields would skip straight to what they needed, cutting both perceived length and review time.
The second: auditors couldn’t copy IDs or links from the old interface, which likely pushed them toward manual note-taking as a workaround rather than a genuine preference. That pointed to a sharper hypothesis — if key identifiers like Tracking IDs and links were copy-enabled by default, auditors would stop keeping external notes altogether, not just navigate faster. It targeted the root behaviour, not only its symptom.
How completion rate was measured
Moderated sessions with a fixed task: locate the full traceability chain unaided. Baseline (57%) pre-redesign; post (82%) measured 4–6 weeks after launch — cross-validated against the drop in engineering sessions spent helping auditors navigate.
Design principles
Four principles guided every interface decision that followed.
Borrow trusted mental models: Folder structures and Notion-style navigation, over novel interactions users would need to learn from scratch.
Design for the data’s real structure: Not the order pages happen to be visited in — persistent, expandable navigation over a literal breadcrumb.
Reduce what users hold in memory: Group related events visually, instead of relying on timestamps alone to imply order.
Make invisible assets tangible: Give abstract, data-only assets a visual anchor buyers can point to.
Strategy
The system only supported direct relational links, so navigation had to prioritize local structure over an ambitious global map.
Two structural constraints shaped the strategy from the outset. Field labels were often fixed to their literal system names — some could be renamed for clarity where the system allowed it, others had to stay as-is. And a unified “network view” of the whole relational structure was explored, but wasn’t technically feasible: the system only supported direct parent/related-record relationships, not a full graph.
Those constraints — not aesthetic preference — are what shaped the decision to prioritize local navigability over an ambitious global map. Every decision below was built inside that boundary, not in spite of it.
Interface showcase
Four decisions, four problems.
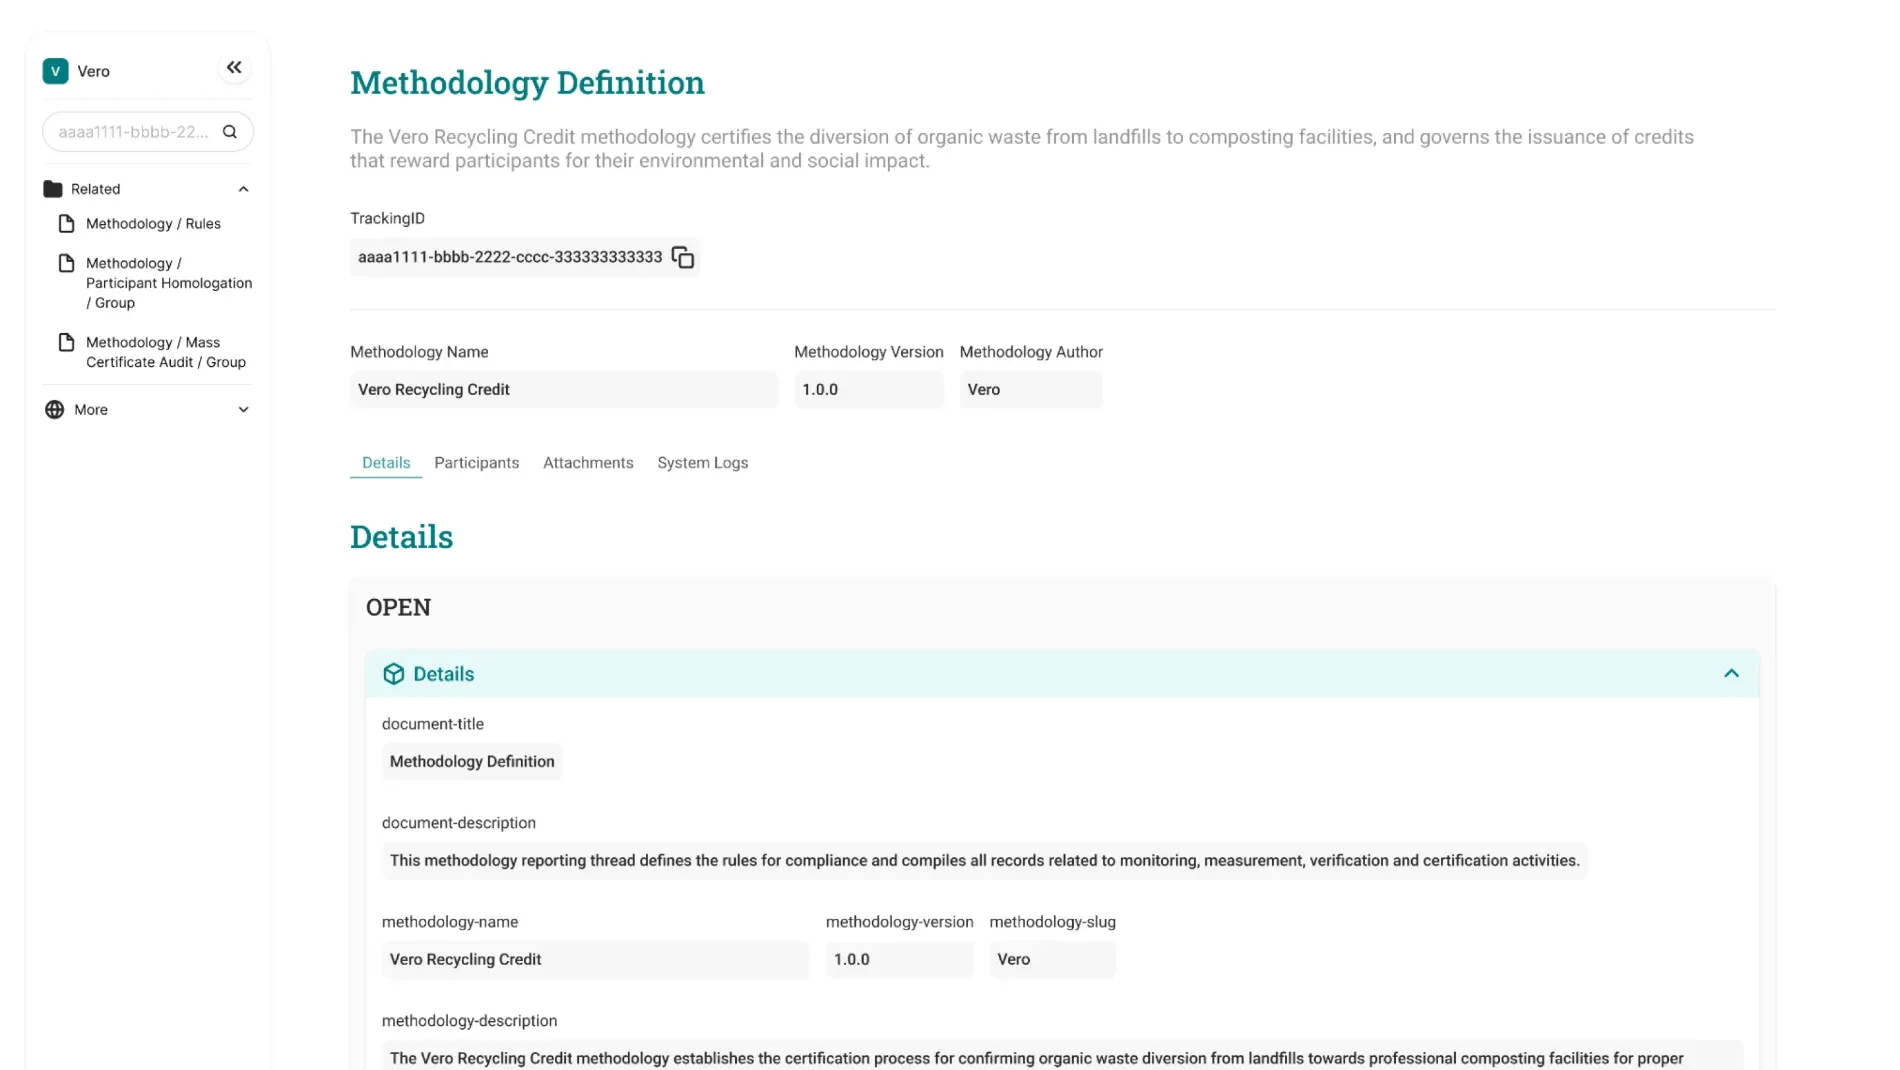
Problem: Every document was connected like a web, but the breadcrumb only recorded the order of pages visited.
Design decision: A persistent left-hand navigation using a familiar mental model — folder structures, like a file explorer or Drive. Every related record type is visible and expandable at a glance, from any starting point.
Result: Navigation loops disappeared, and auditor session time dropped from 2+ hours to under 1 hour.
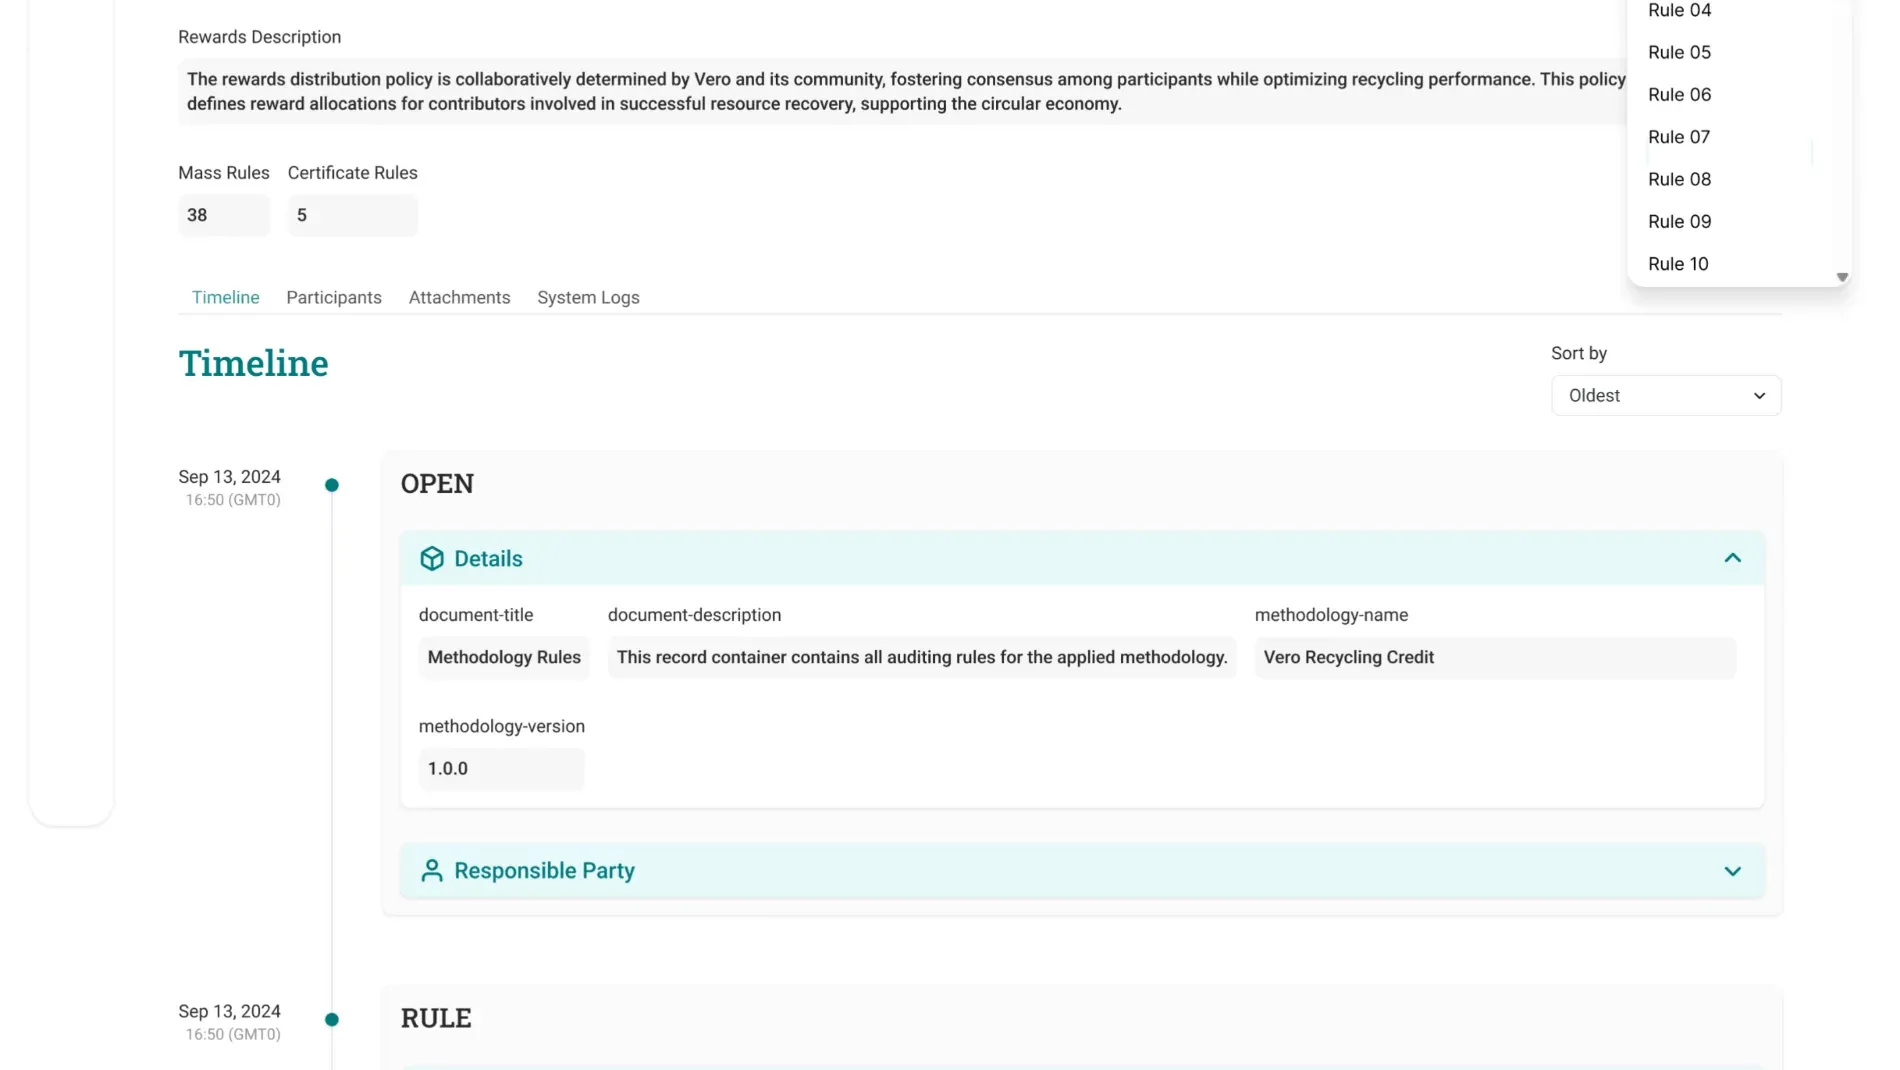
Problem: The original system relied on timestamps alone to imply order — forcing users to mentally reconstruct which event caused which, since nothing in the UI grouped related steps together.
Design decision: A visual timeline using nested shapes instead of strokes, grouping related entries inside soft containers, with a restrained gray/blue/white palette to signal hierarchy without visual noise. Tabs were added for extra clarity: the timeline contained everything, but if a participant needed auditing, tracking was easier.
Trust reinforced: Auditors could see, at a glance, what triggered what — critical in a system whose entire value proposition is data integrity.
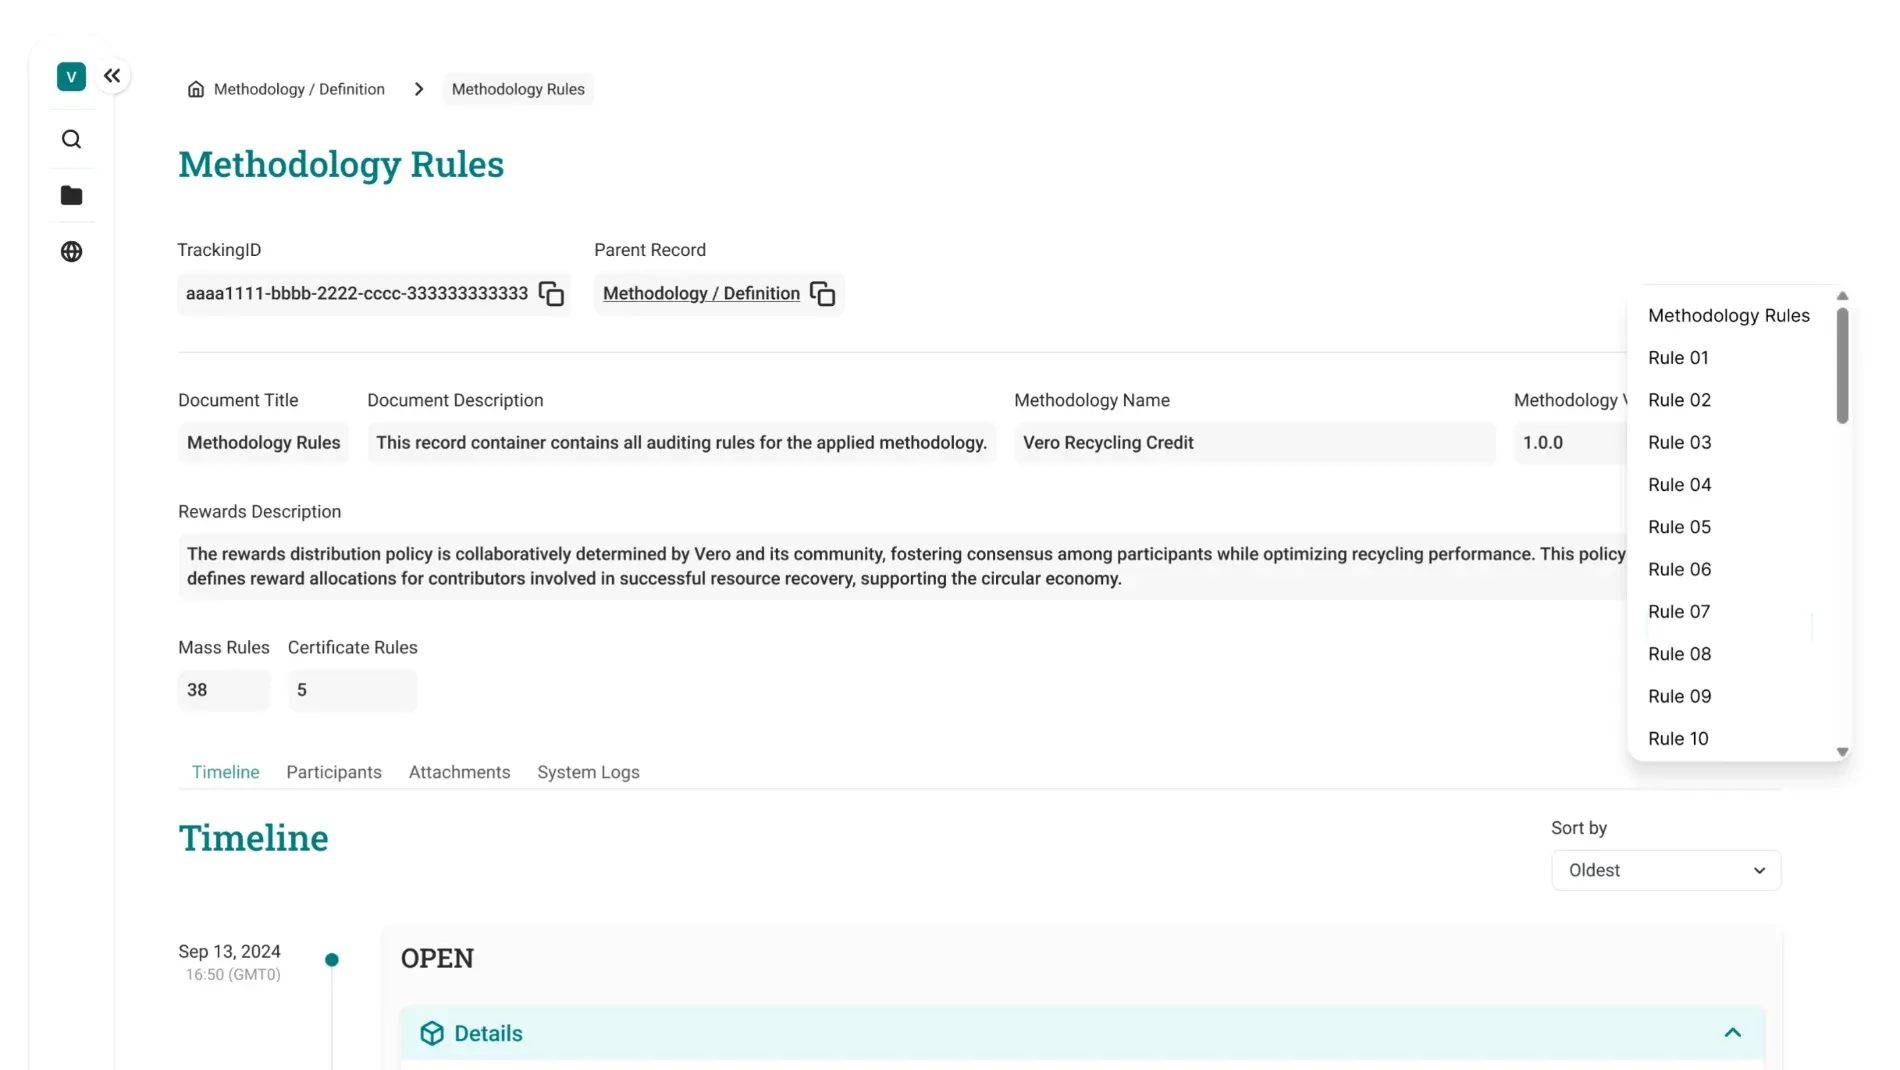
Problem: Documents like Methodology Definition could contain 30+ subsections — scroll fatigue was real and measurable in session feedback.
Design decision: A floating table of contents, inspired by Notion, letting users jump directly to any section while staying oriented in the larger structure. Notion was chosen deliberately as the benchmark: the goal was a pattern users already trusted from daily tools, not a novel interaction to learn.
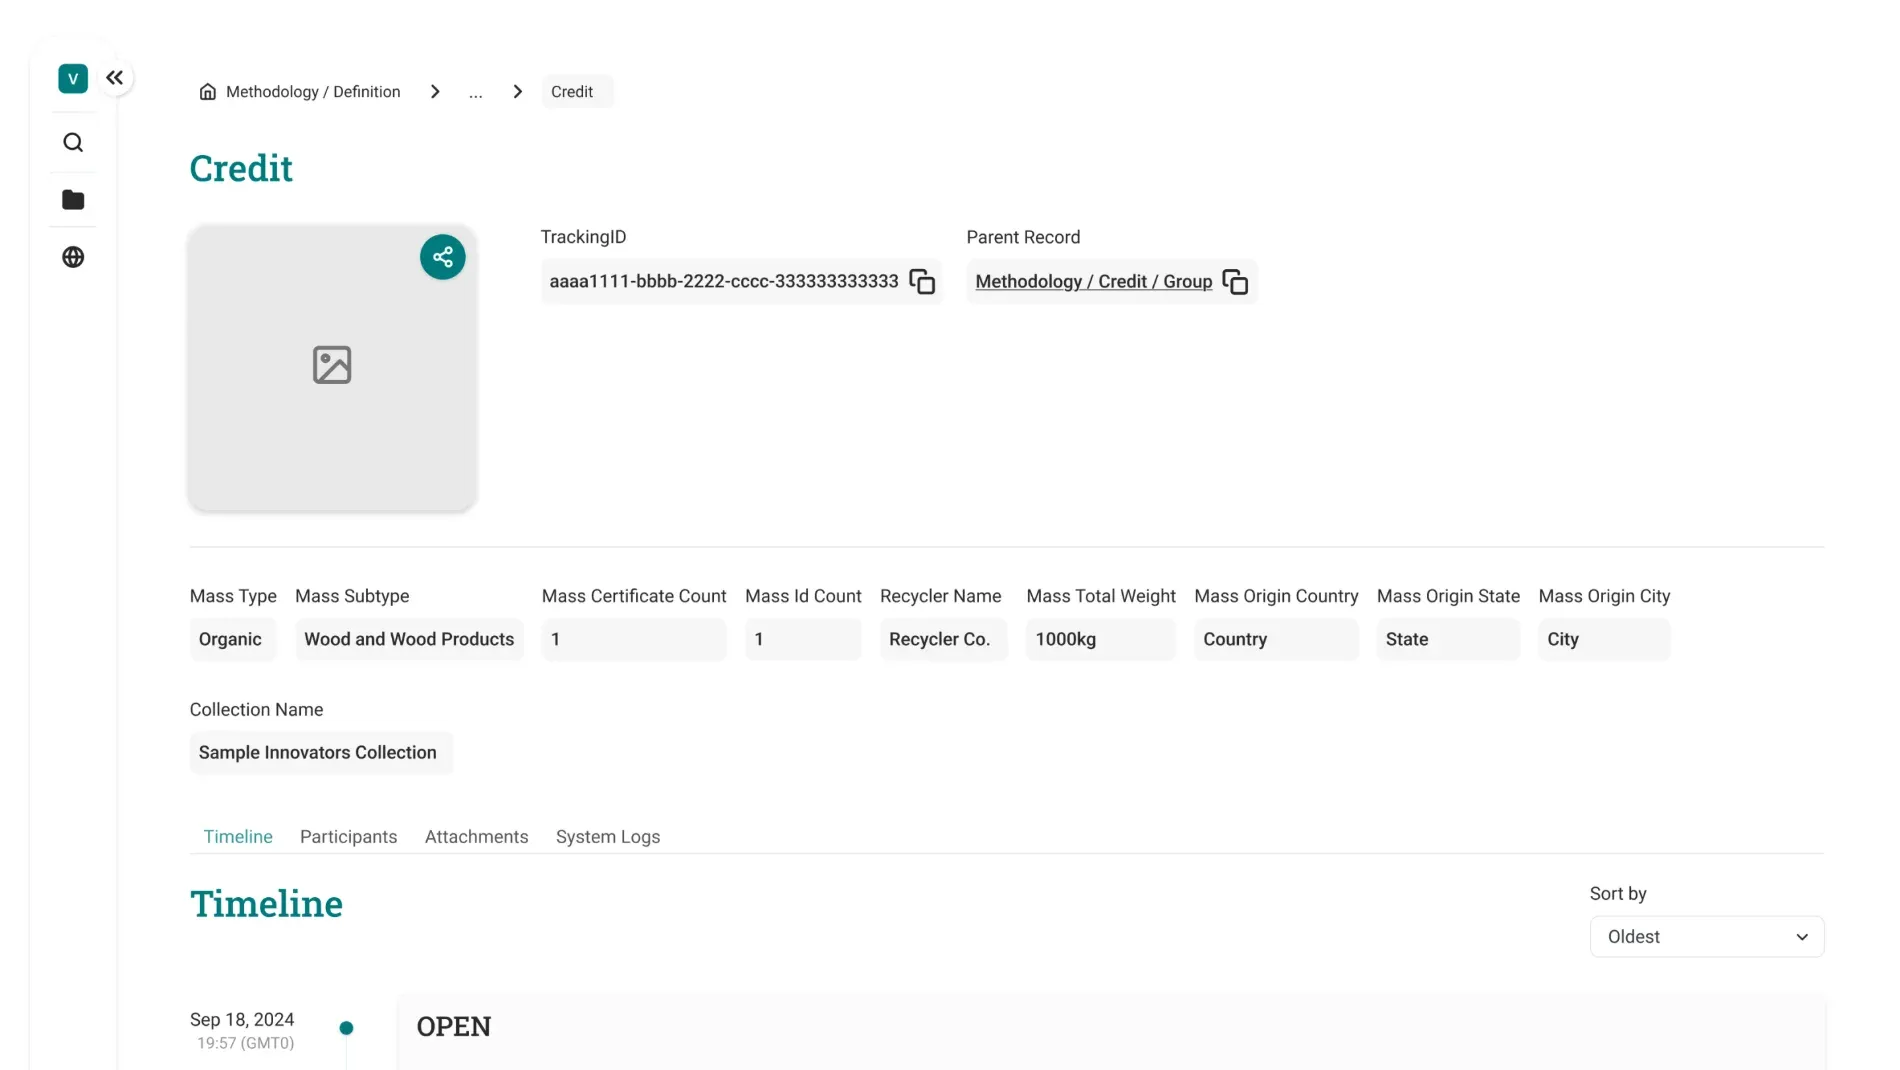
Problem: Buyers valued the mission but couldn’t feel ownership of what they’d bought — a carbon credit is, by nature, invisible.
Design decision: The NFT artwork appears directly inside the Credit record, connecting the technical process — audit, mass, participants — to a tangible visual output. It’s a direct bridge between traceability (trust) and ownership (value): the two things buyers wanted but couldn’t reconcile.
Design system
136 components, derived from one set of shared primitives, scaling across two platforms.
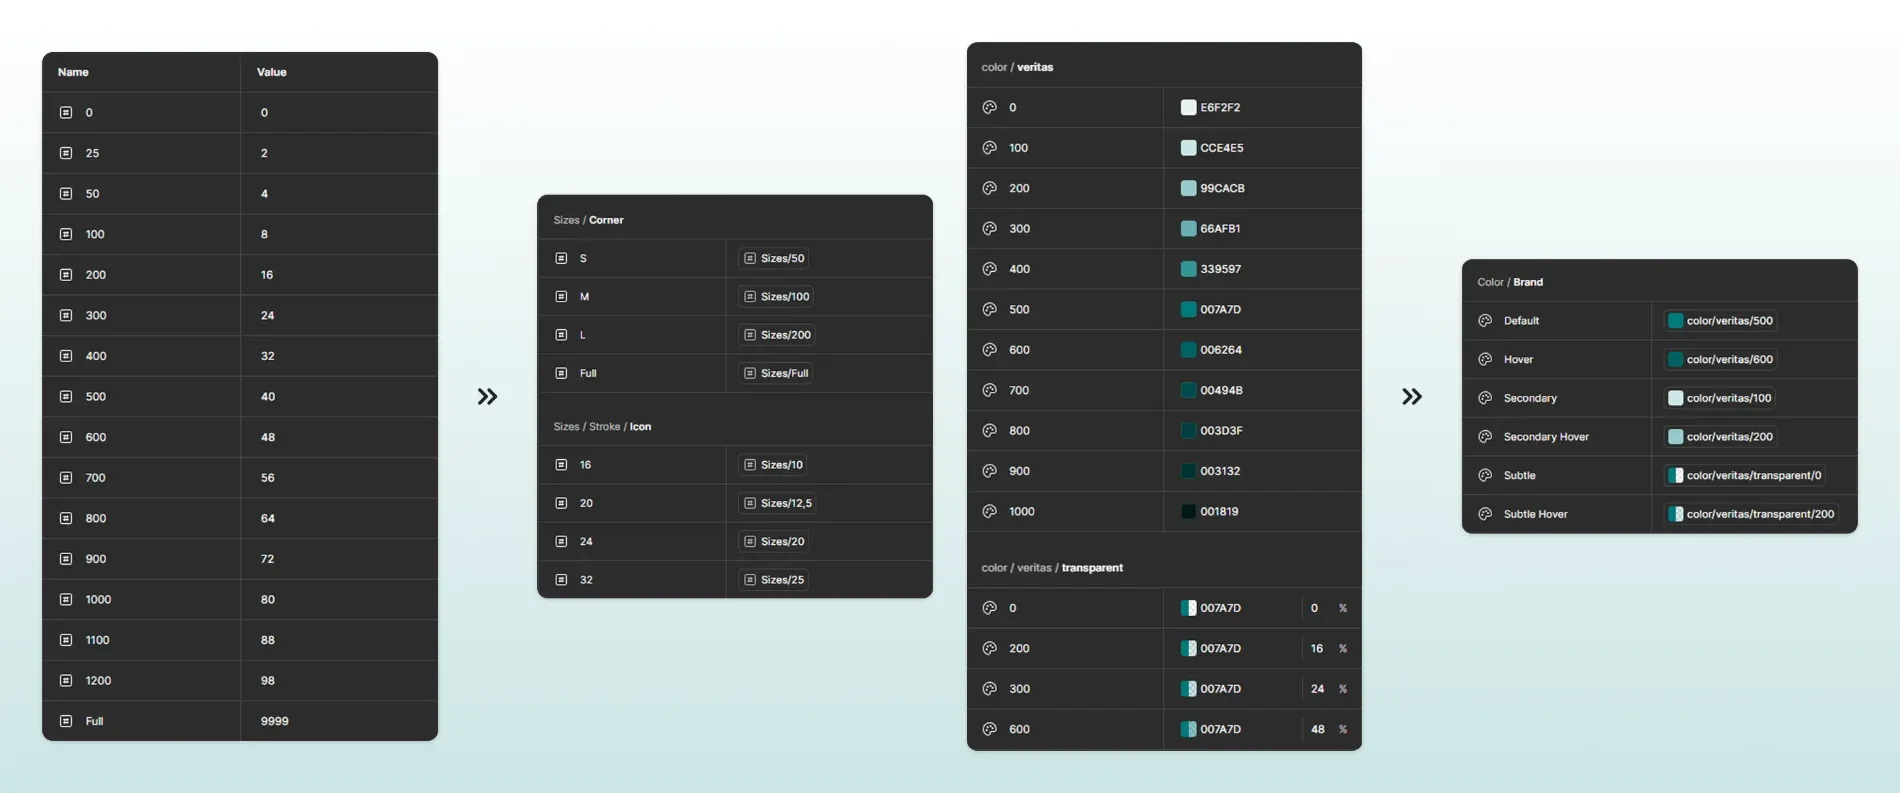
Built entirely in Figma using variants: every element — typography, spacing, color — scaled through a small/medium/large system. Color was built as primitive ramps (100→900 per hue), consumed by semantic variants (primary, secondary, tertiary, neutral). The system was shared across both the portal and the institutional website: two platforms, different tools, one consistent system.
Before / after
Four structural swaps.
Literal breadcrumb, no persistent navigation: became a persistent folder-style map, expandable from any point.
Timestamps alone to imply order: became a nested-shape timeline grouping related events.
Long documents meant endless scrolling: became a floating, Notion-inspired table of contents.
The credit was an invisible ledger entry: became a record with the NFT artwork inside it.
Outcomes
Journey completion rose from 57% to 82% once the redesigned structure made traceability navigable on its own.
Journey completion was measured through moderated usability sessions with a fixed task, comparing the pre-redesign baseline against 4–6 weeks post-launch — cross-validated against the drop in engineering sessions spent helping auditors navigate.
Task time
Cut from 2+ hours to under 1 hour, beating the original 1h30 target.
Legibility without prior knowledge
Validated qualitatively: the persistent folder navigation and nested timeline were tested with auditors who had never used the platform before, and they completed the traceability task without onboarding.
Tangibility of the asset
Validated qualitatively through buyer feedback after the NFT-in-record redesign — buyers reported for the first time being able to point to “what they owned,” rather than describing it as an abstract ledger entry.
Reflection
The numbers already told the story. What’s left is what I’d change — and who made it possible.
What I’d do differently
Instrument analytics from day one, so the 57% → 82% metric didn’t rely solely on moderated sessions · document methodology-type variation earlier, since navigation assumed a uniform structure that may not hold at scale · push harder for different views and profiles across all 3 personas · push earlier for copy-enabled identifiers, instead of discovering that gap only through auditors’ manual note-taking workaround.
Design ↔ Research Designer: The research-focused designer owned methodology validation and business-logic accuracy while I focused on UX/UI — a split that let the project move faster on interface decisions without re-litigating rules each time.
Design ↔ Engineering: Weekly syncs to align scope and complexity, surfacing data-model constraints (fixed field names, relation depth) before designs were finalized, not after.
Design ↔ Marketing: Post-launch, marketing tracked qualified lead conversion on the institutional site (a directional +15% signal), providing early external context for the redesign’s business impact.
"The system — not any single screen — is what let one designer ship a complex concept in such a short time."
Closing thought
Let's talk